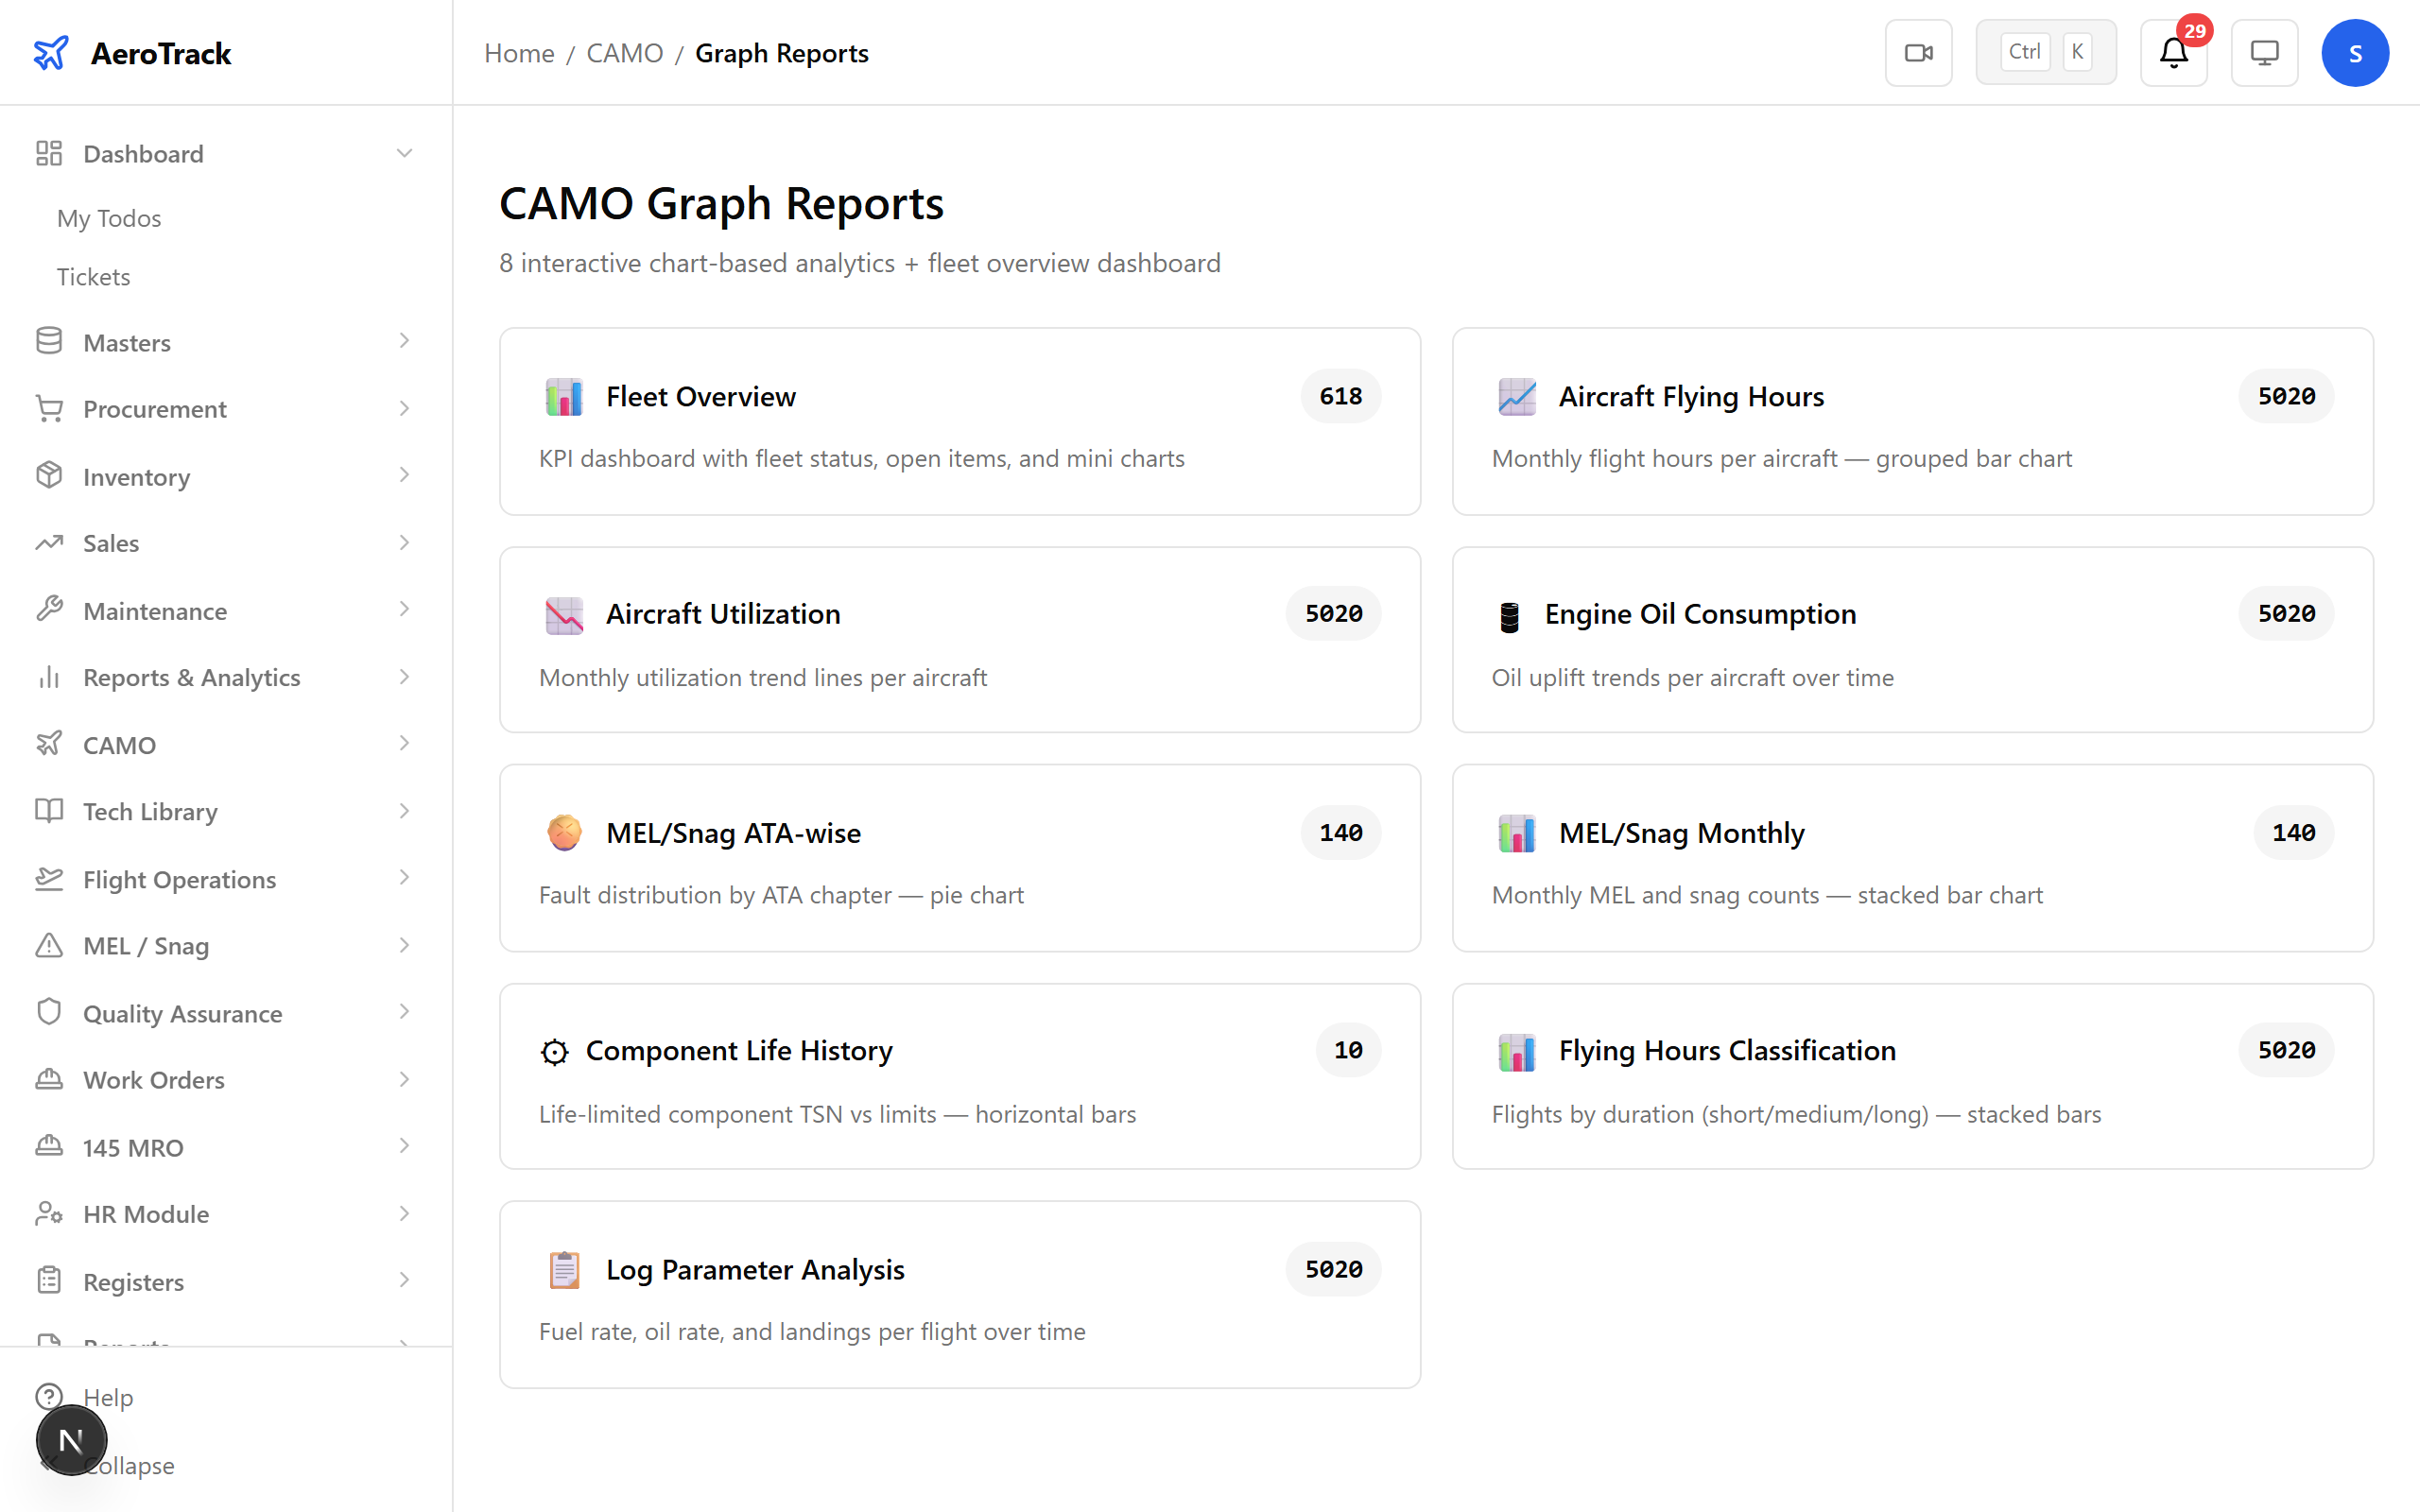
Step 1 — The CAMO Graphs Hub
Navigate to CAMO → Graphs. The index page shows all 8 graph types organised by category — utilisation, maintenance hours, reliability, defects, costs, and component life.

Tip: Each graph is interactive — hover for details, filter by aircraft or date range, and export chart data.
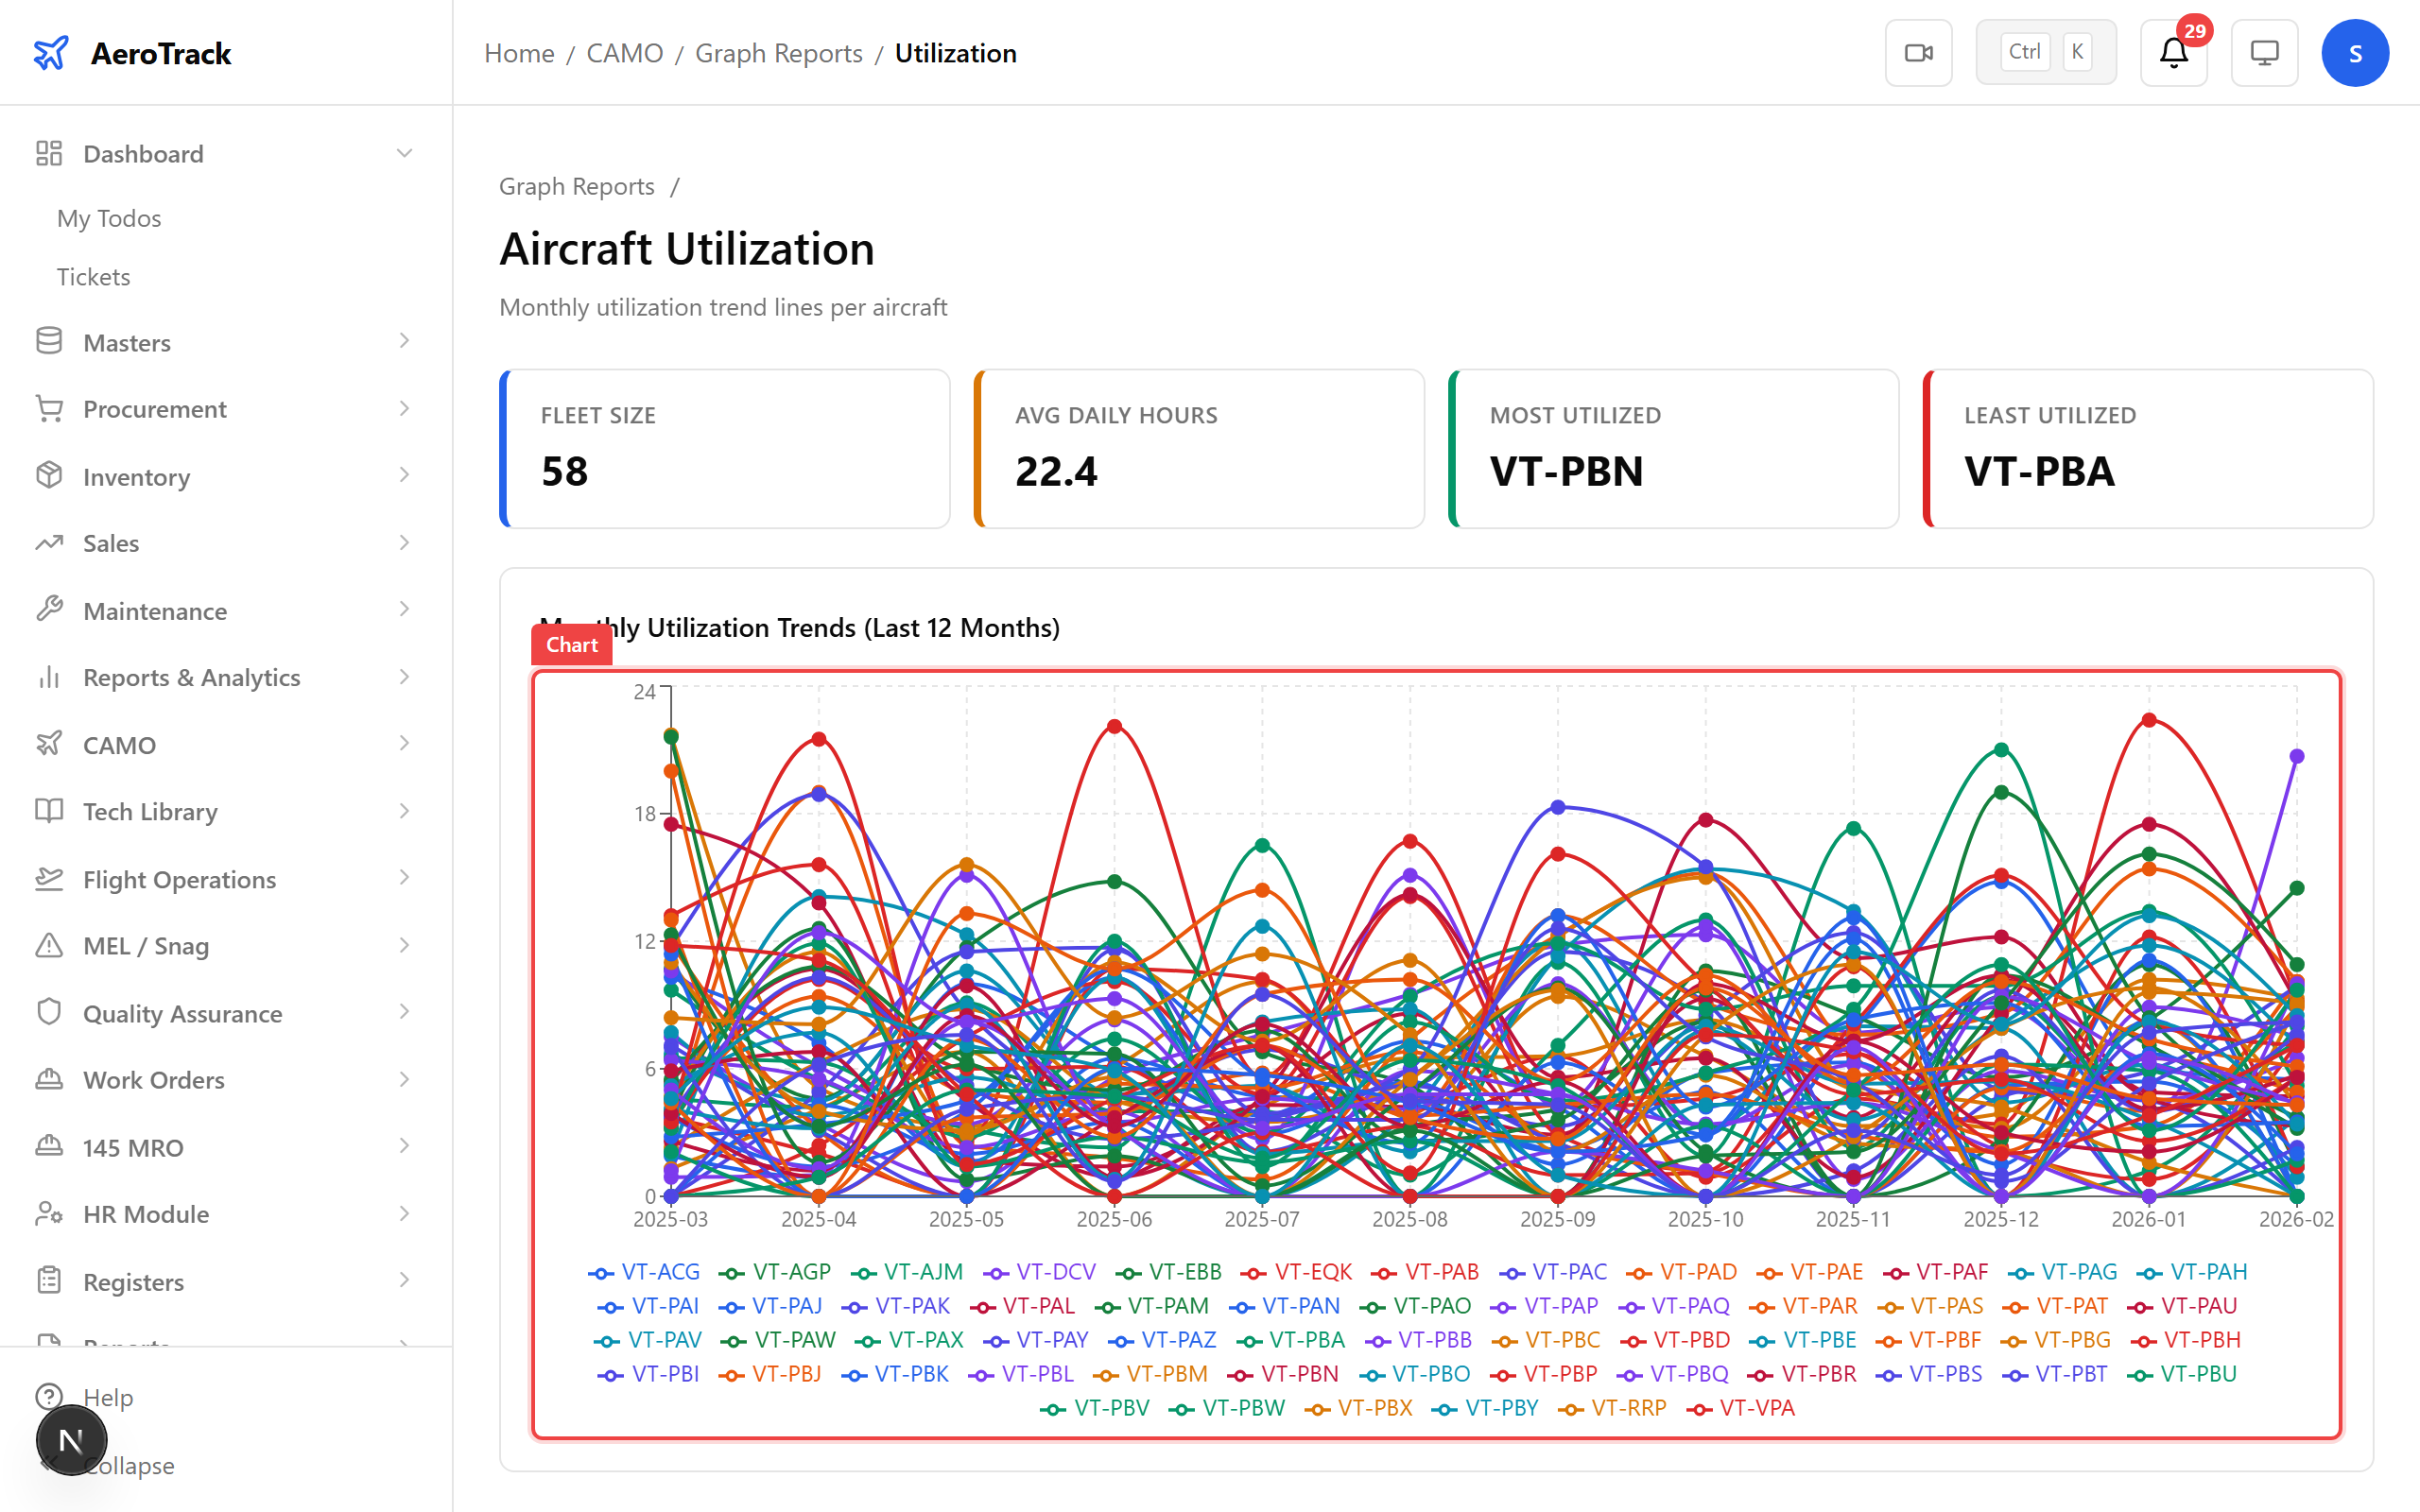
Step 2 — Fleet Utilisation
The Fleet Utilization chart visualises flight hours and cycles across your aircraft. Compare monthly utilisation to spot underused or overworked airframes.
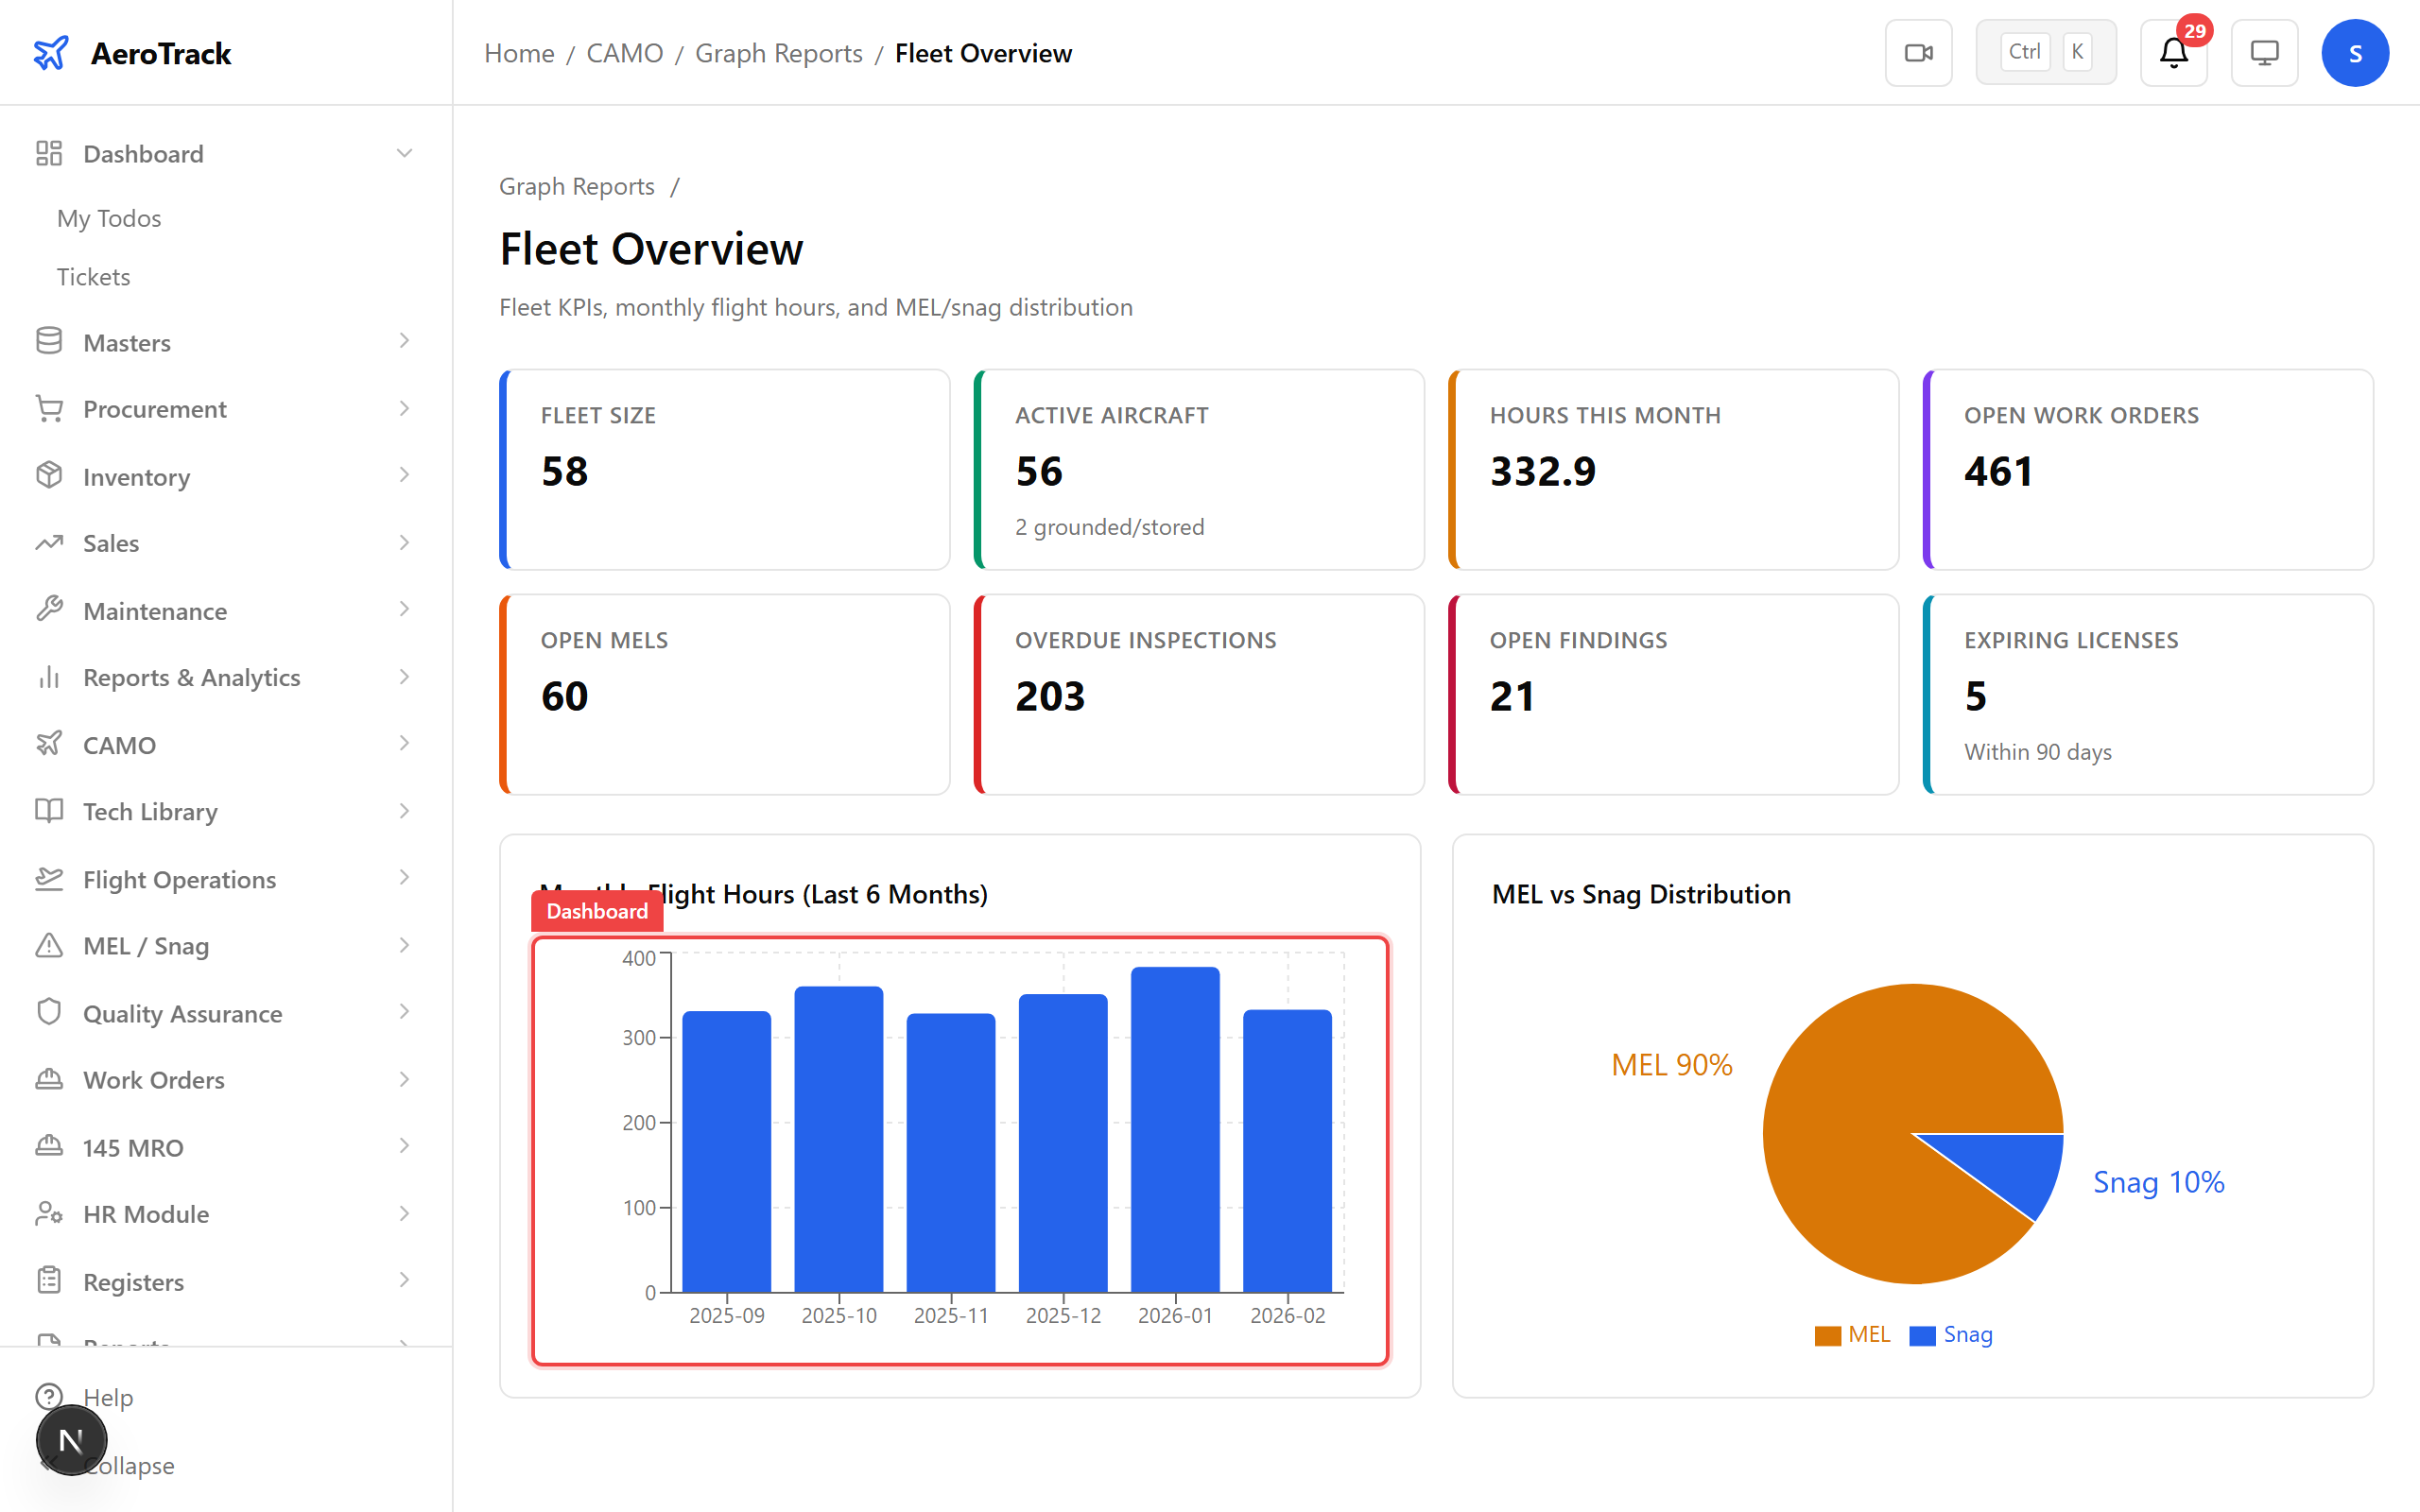
Step 3 — Fleet Availability
The Fleet Overview dashboard shows dispatch reliability, aircraft-on-ground trends, and overall fleet availability — the KPIs your operations team watches most.
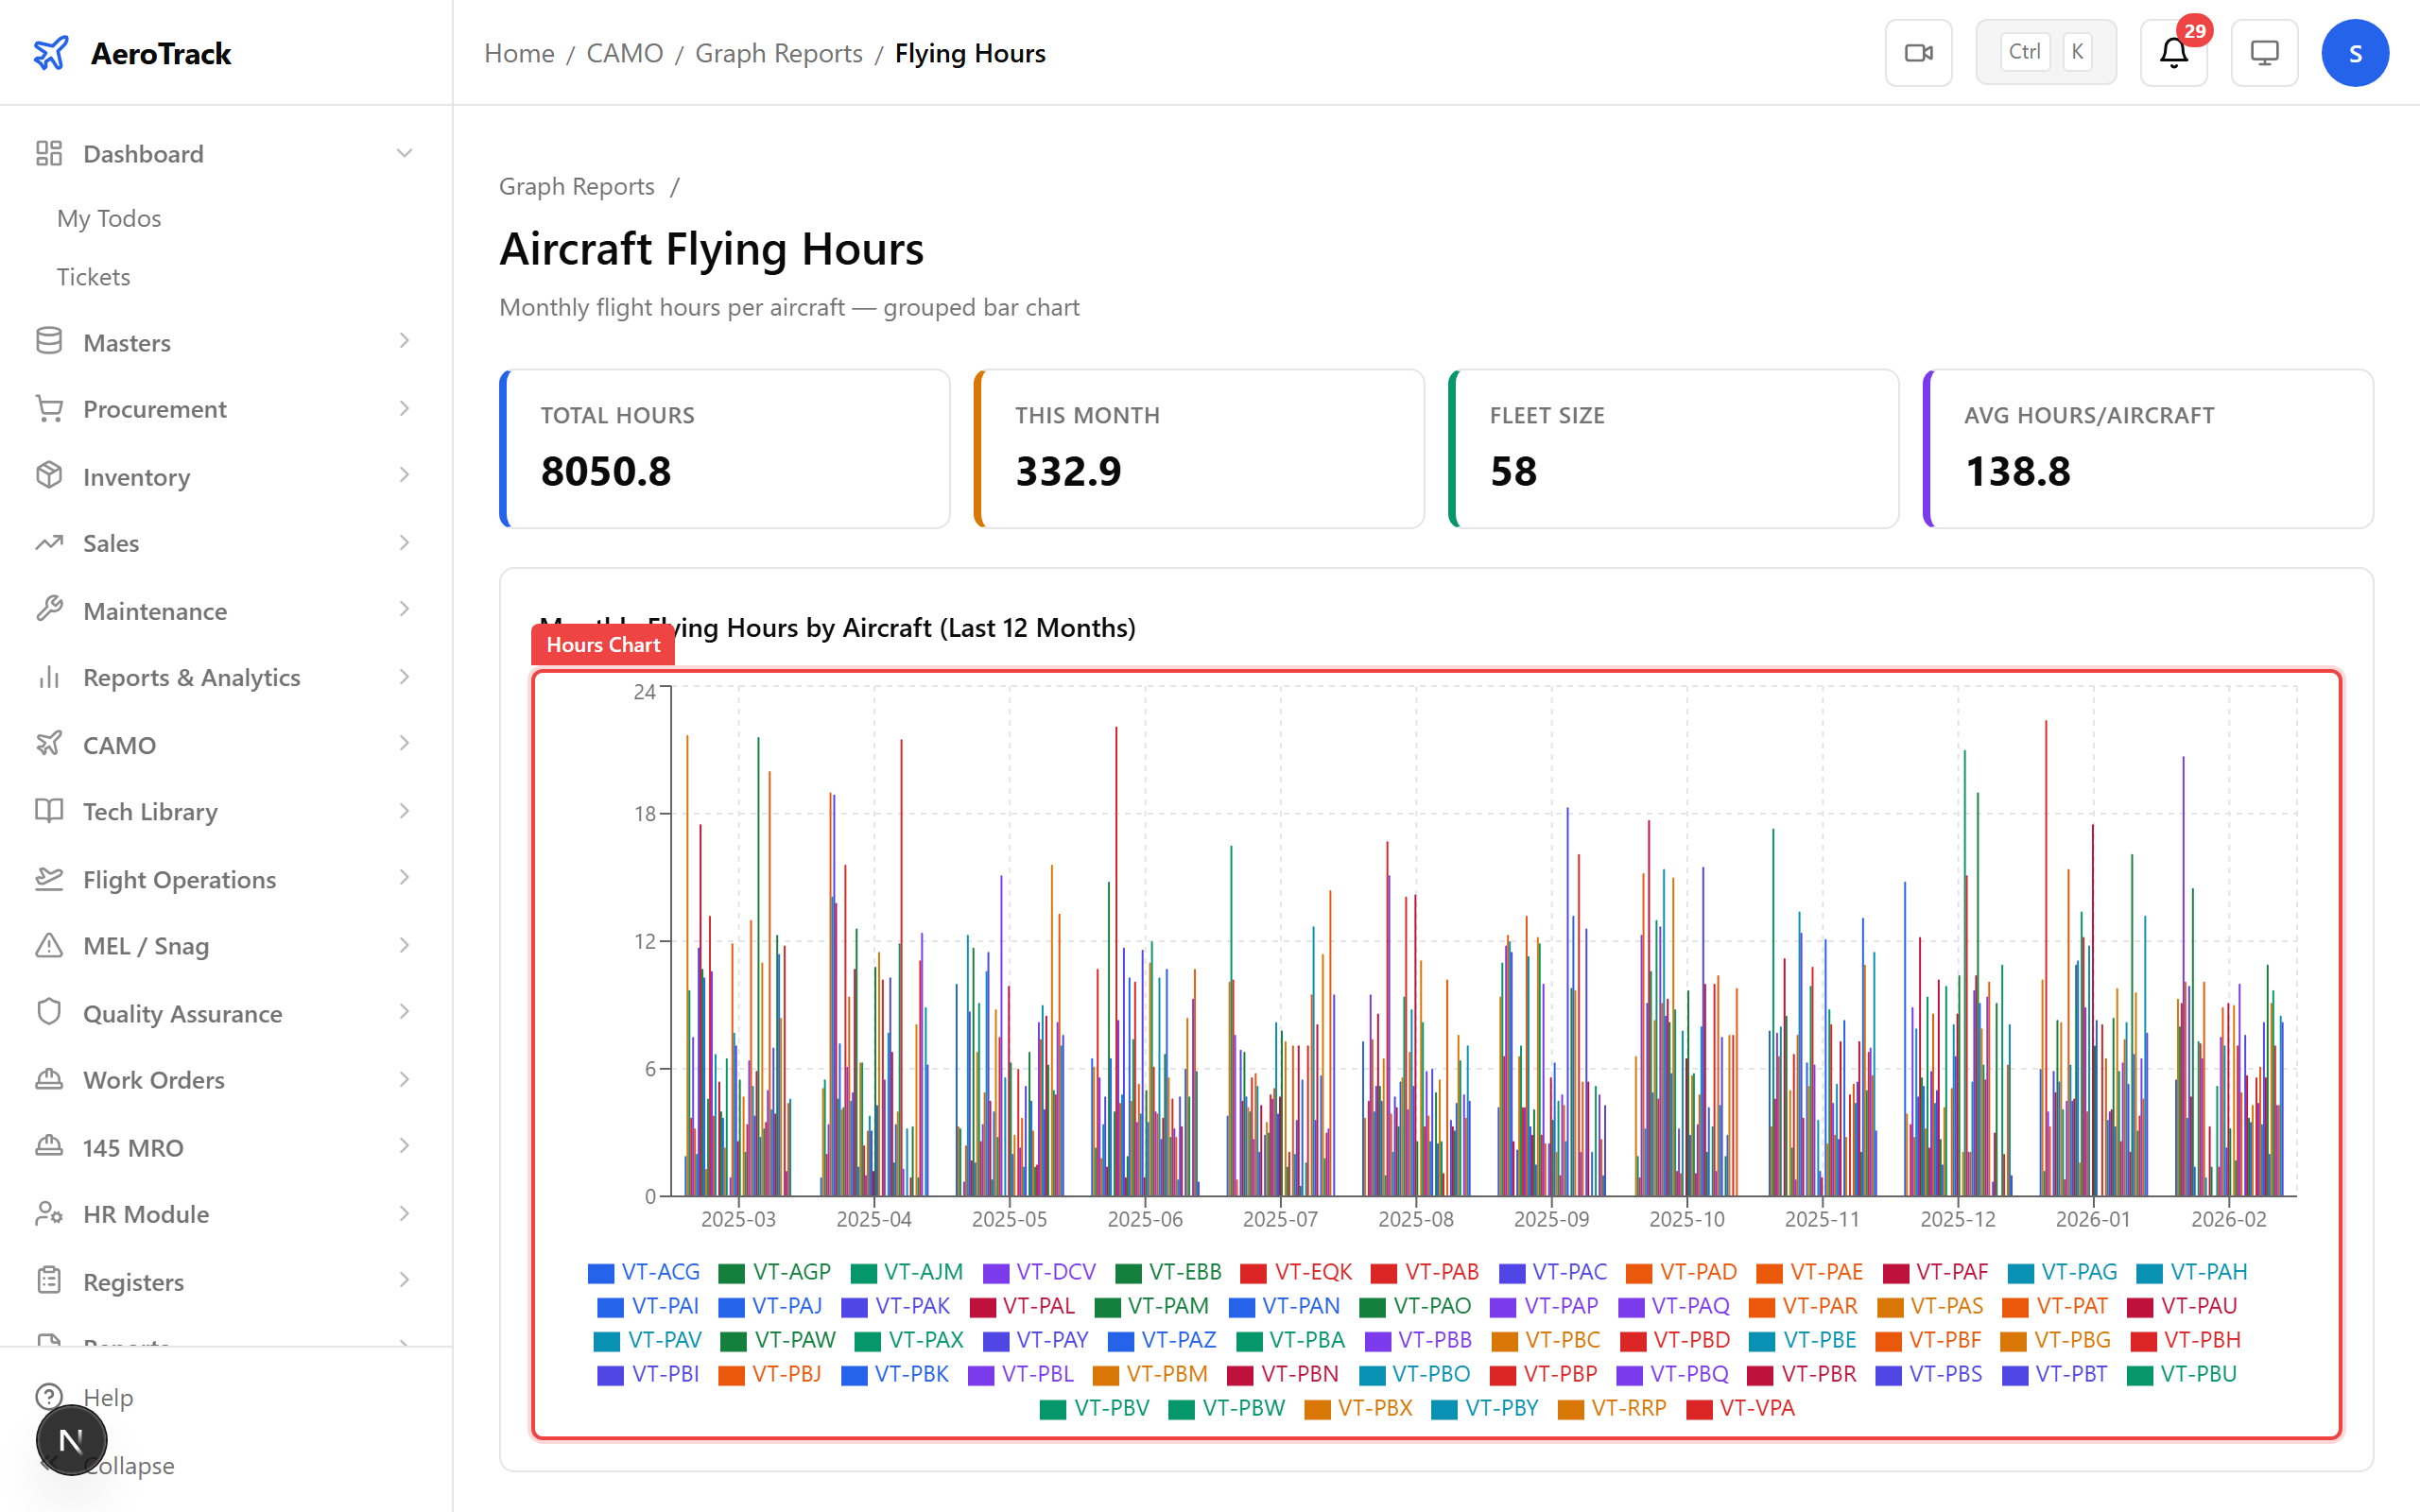
Step 4 — Flying Hours
The Flying Hours bar chart shows flight time by aircraft and period — useful for tracking maintenance intervals tied to flight hours.
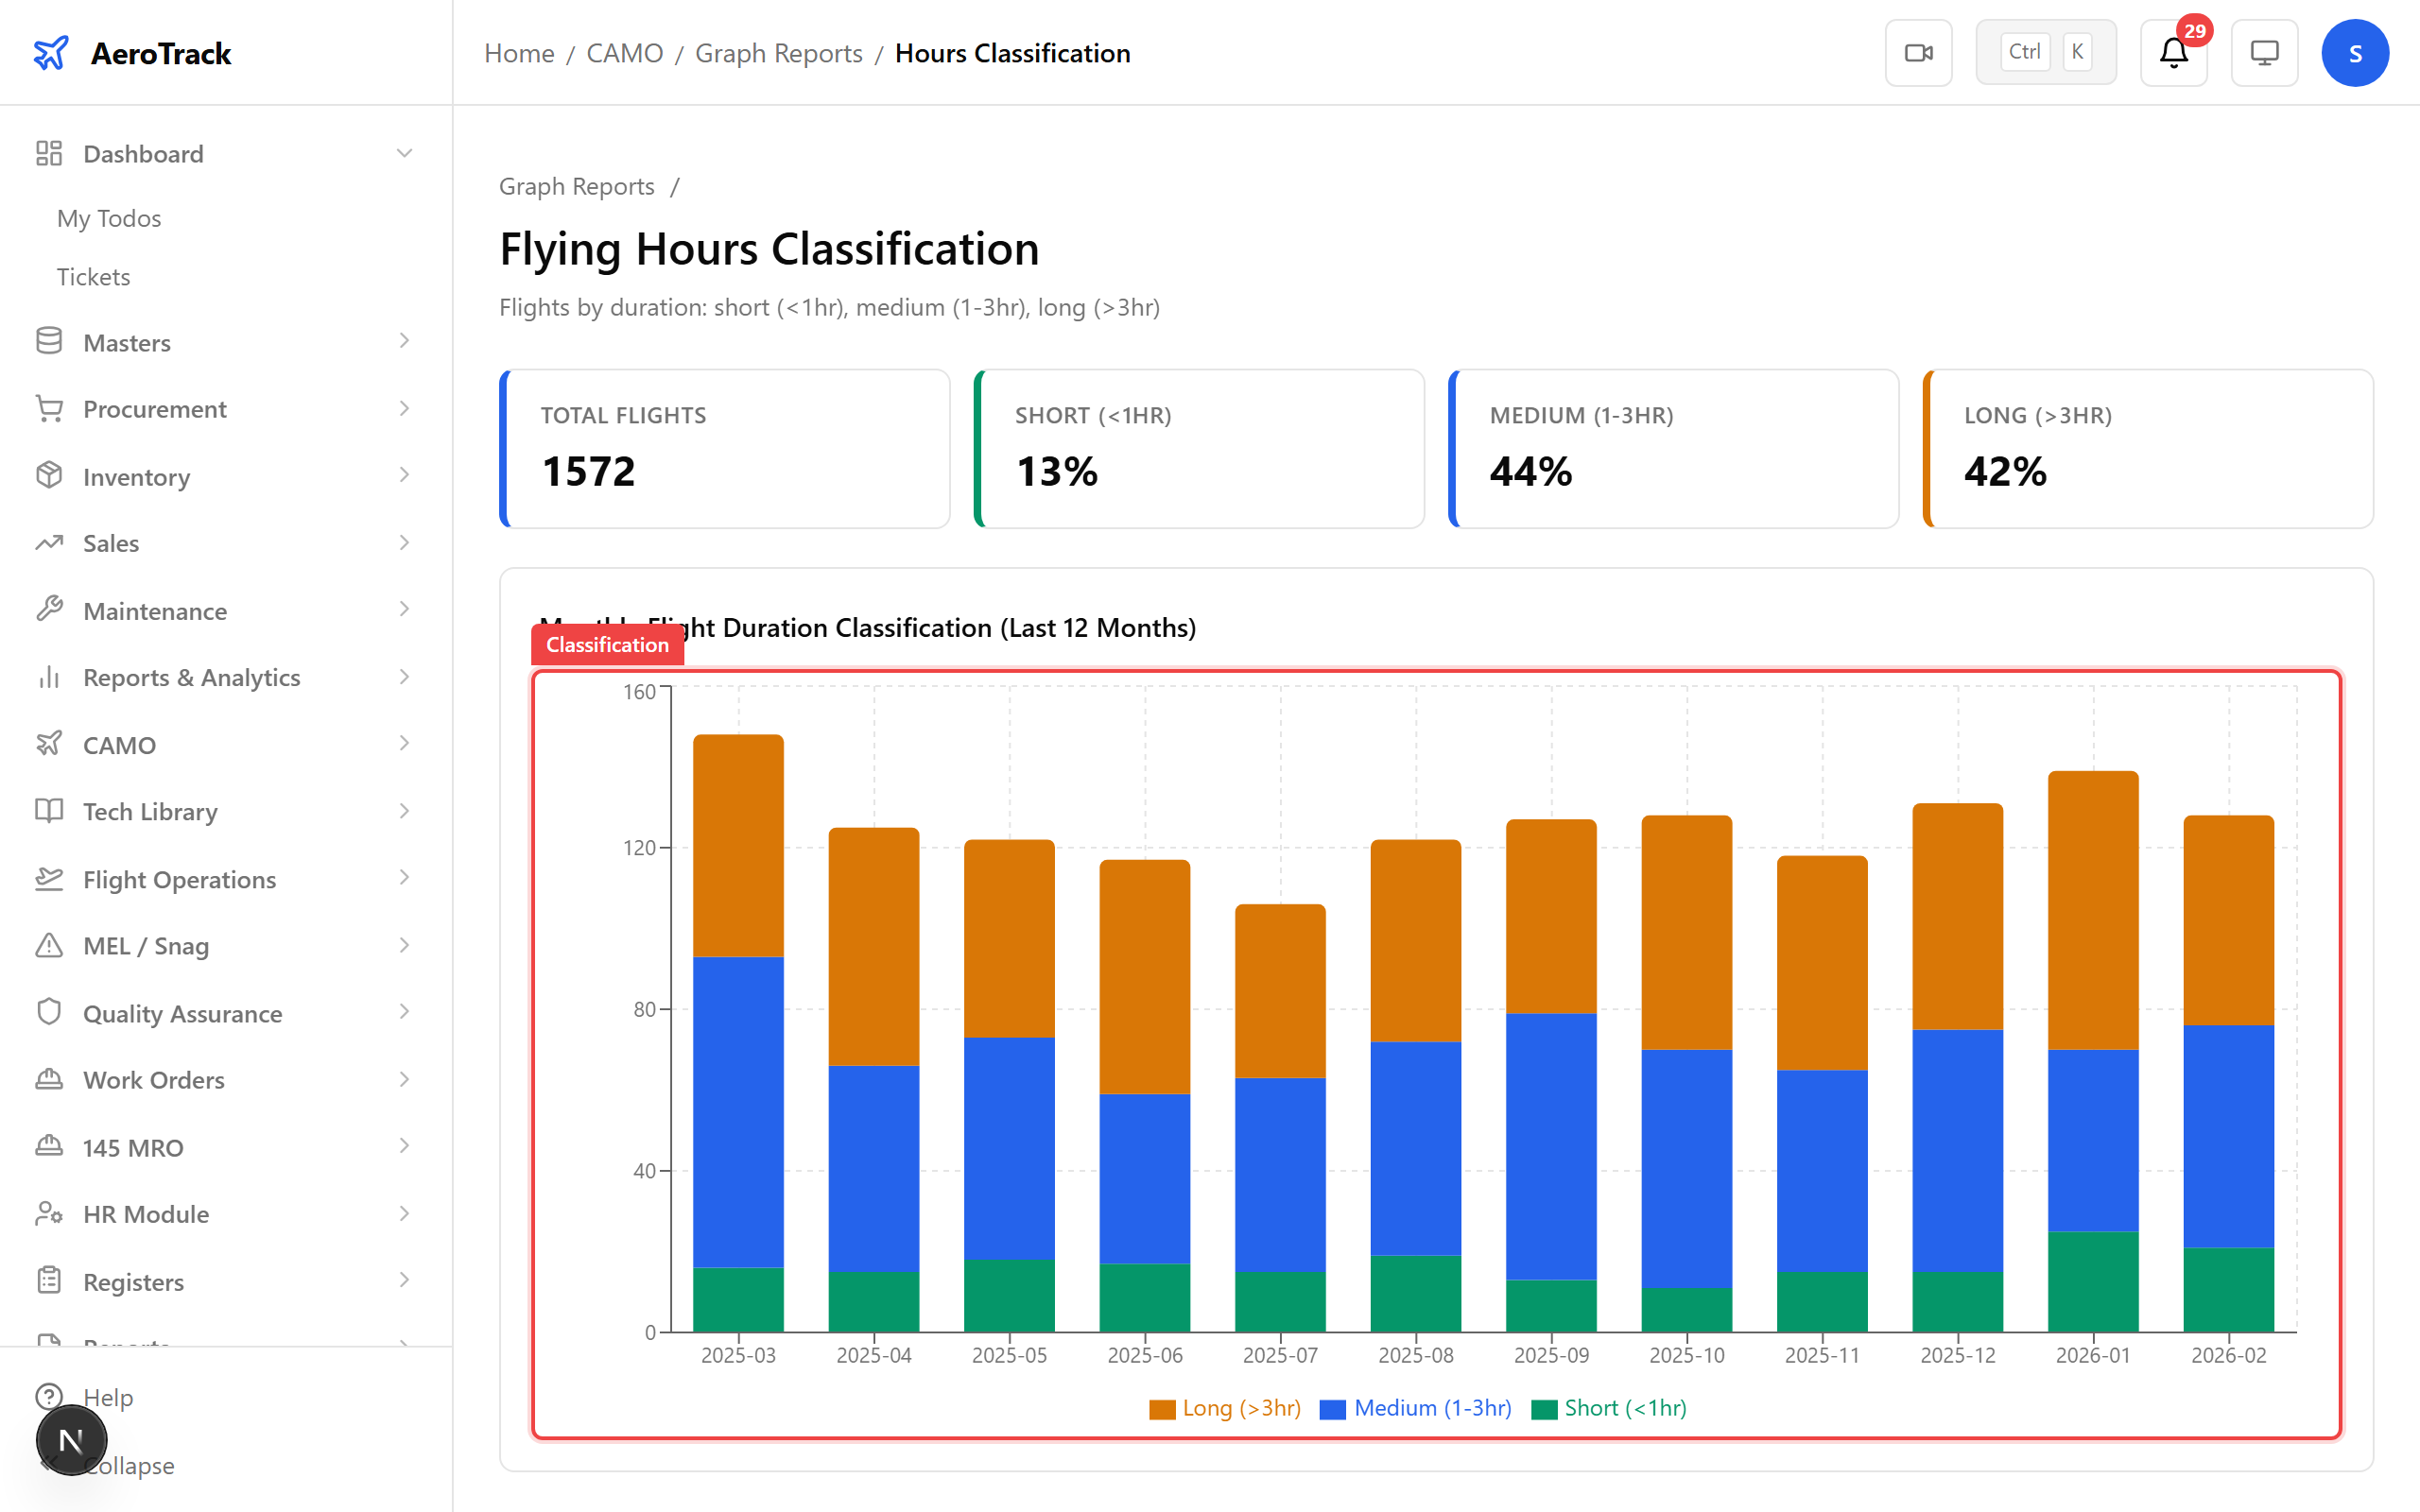
Step 5 — Hours Classification
The Hours Classification chart breaks down flight time by category — revenue, training, ferry, test, and maintenance flights.
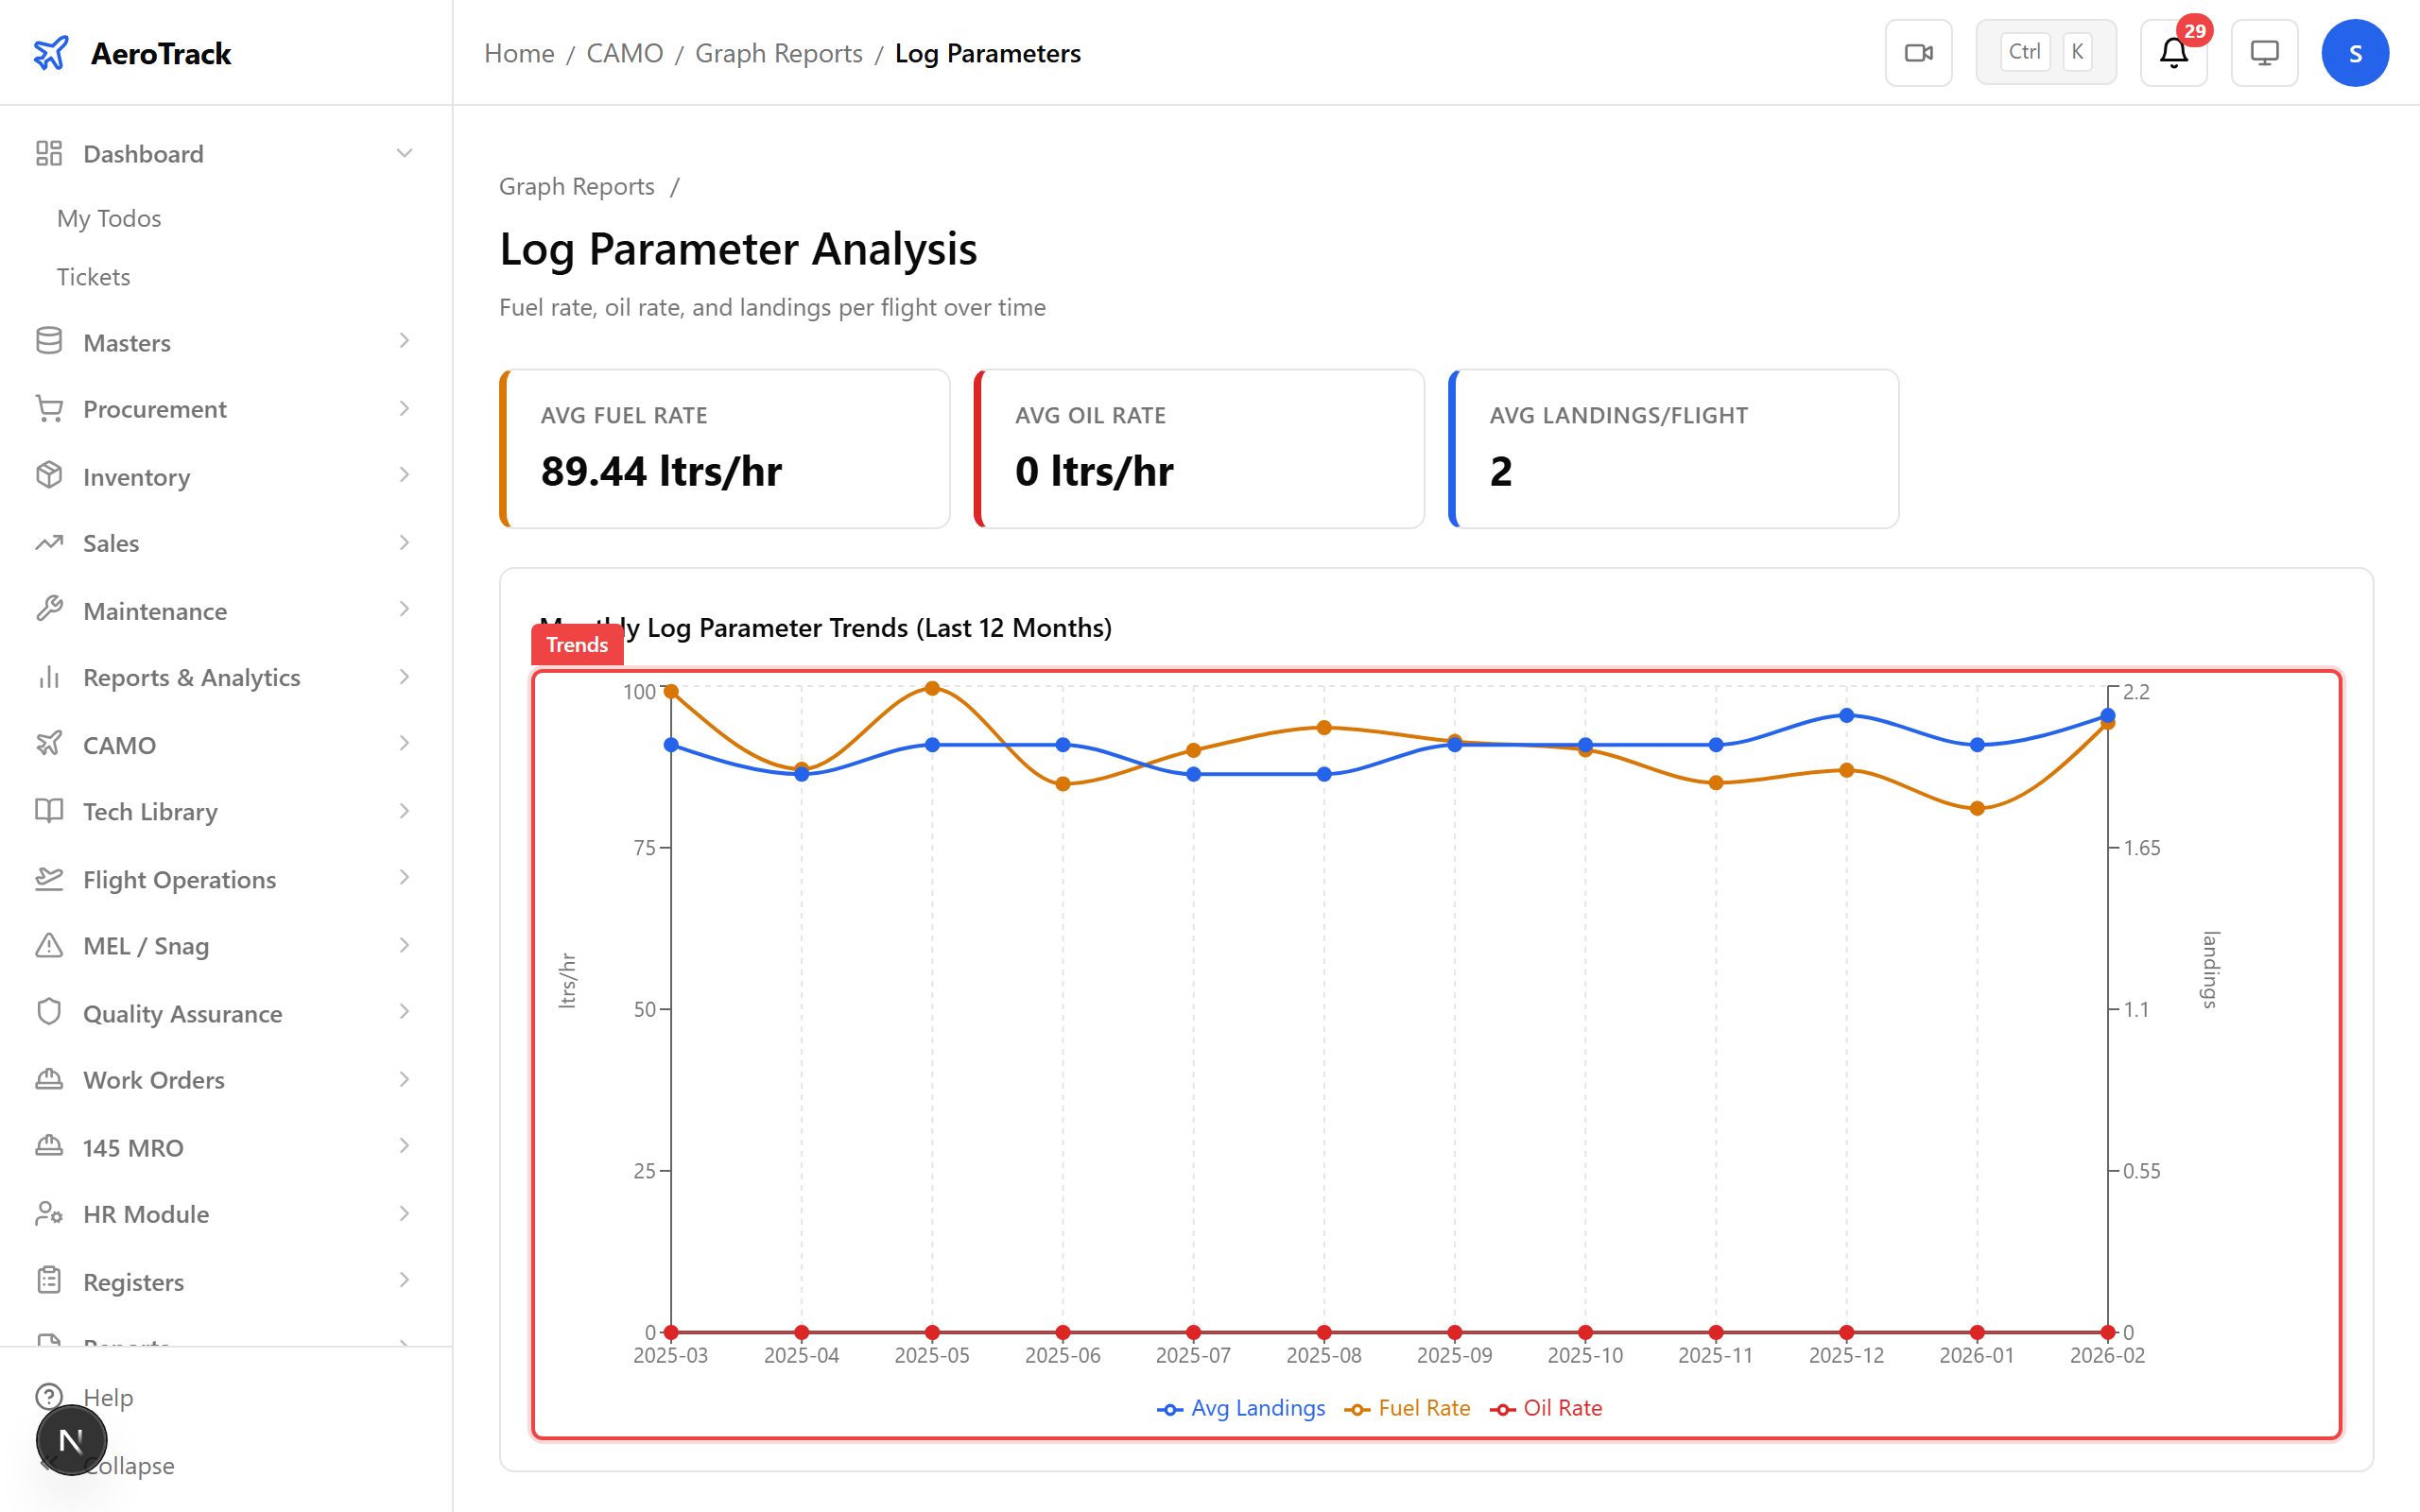
Step 6 — Log Parameters
The Log Parameters graph tracks engine and airframe parameters over time — oil pressure, EGT, vibration levels — to spot reliability trends before they become failures.
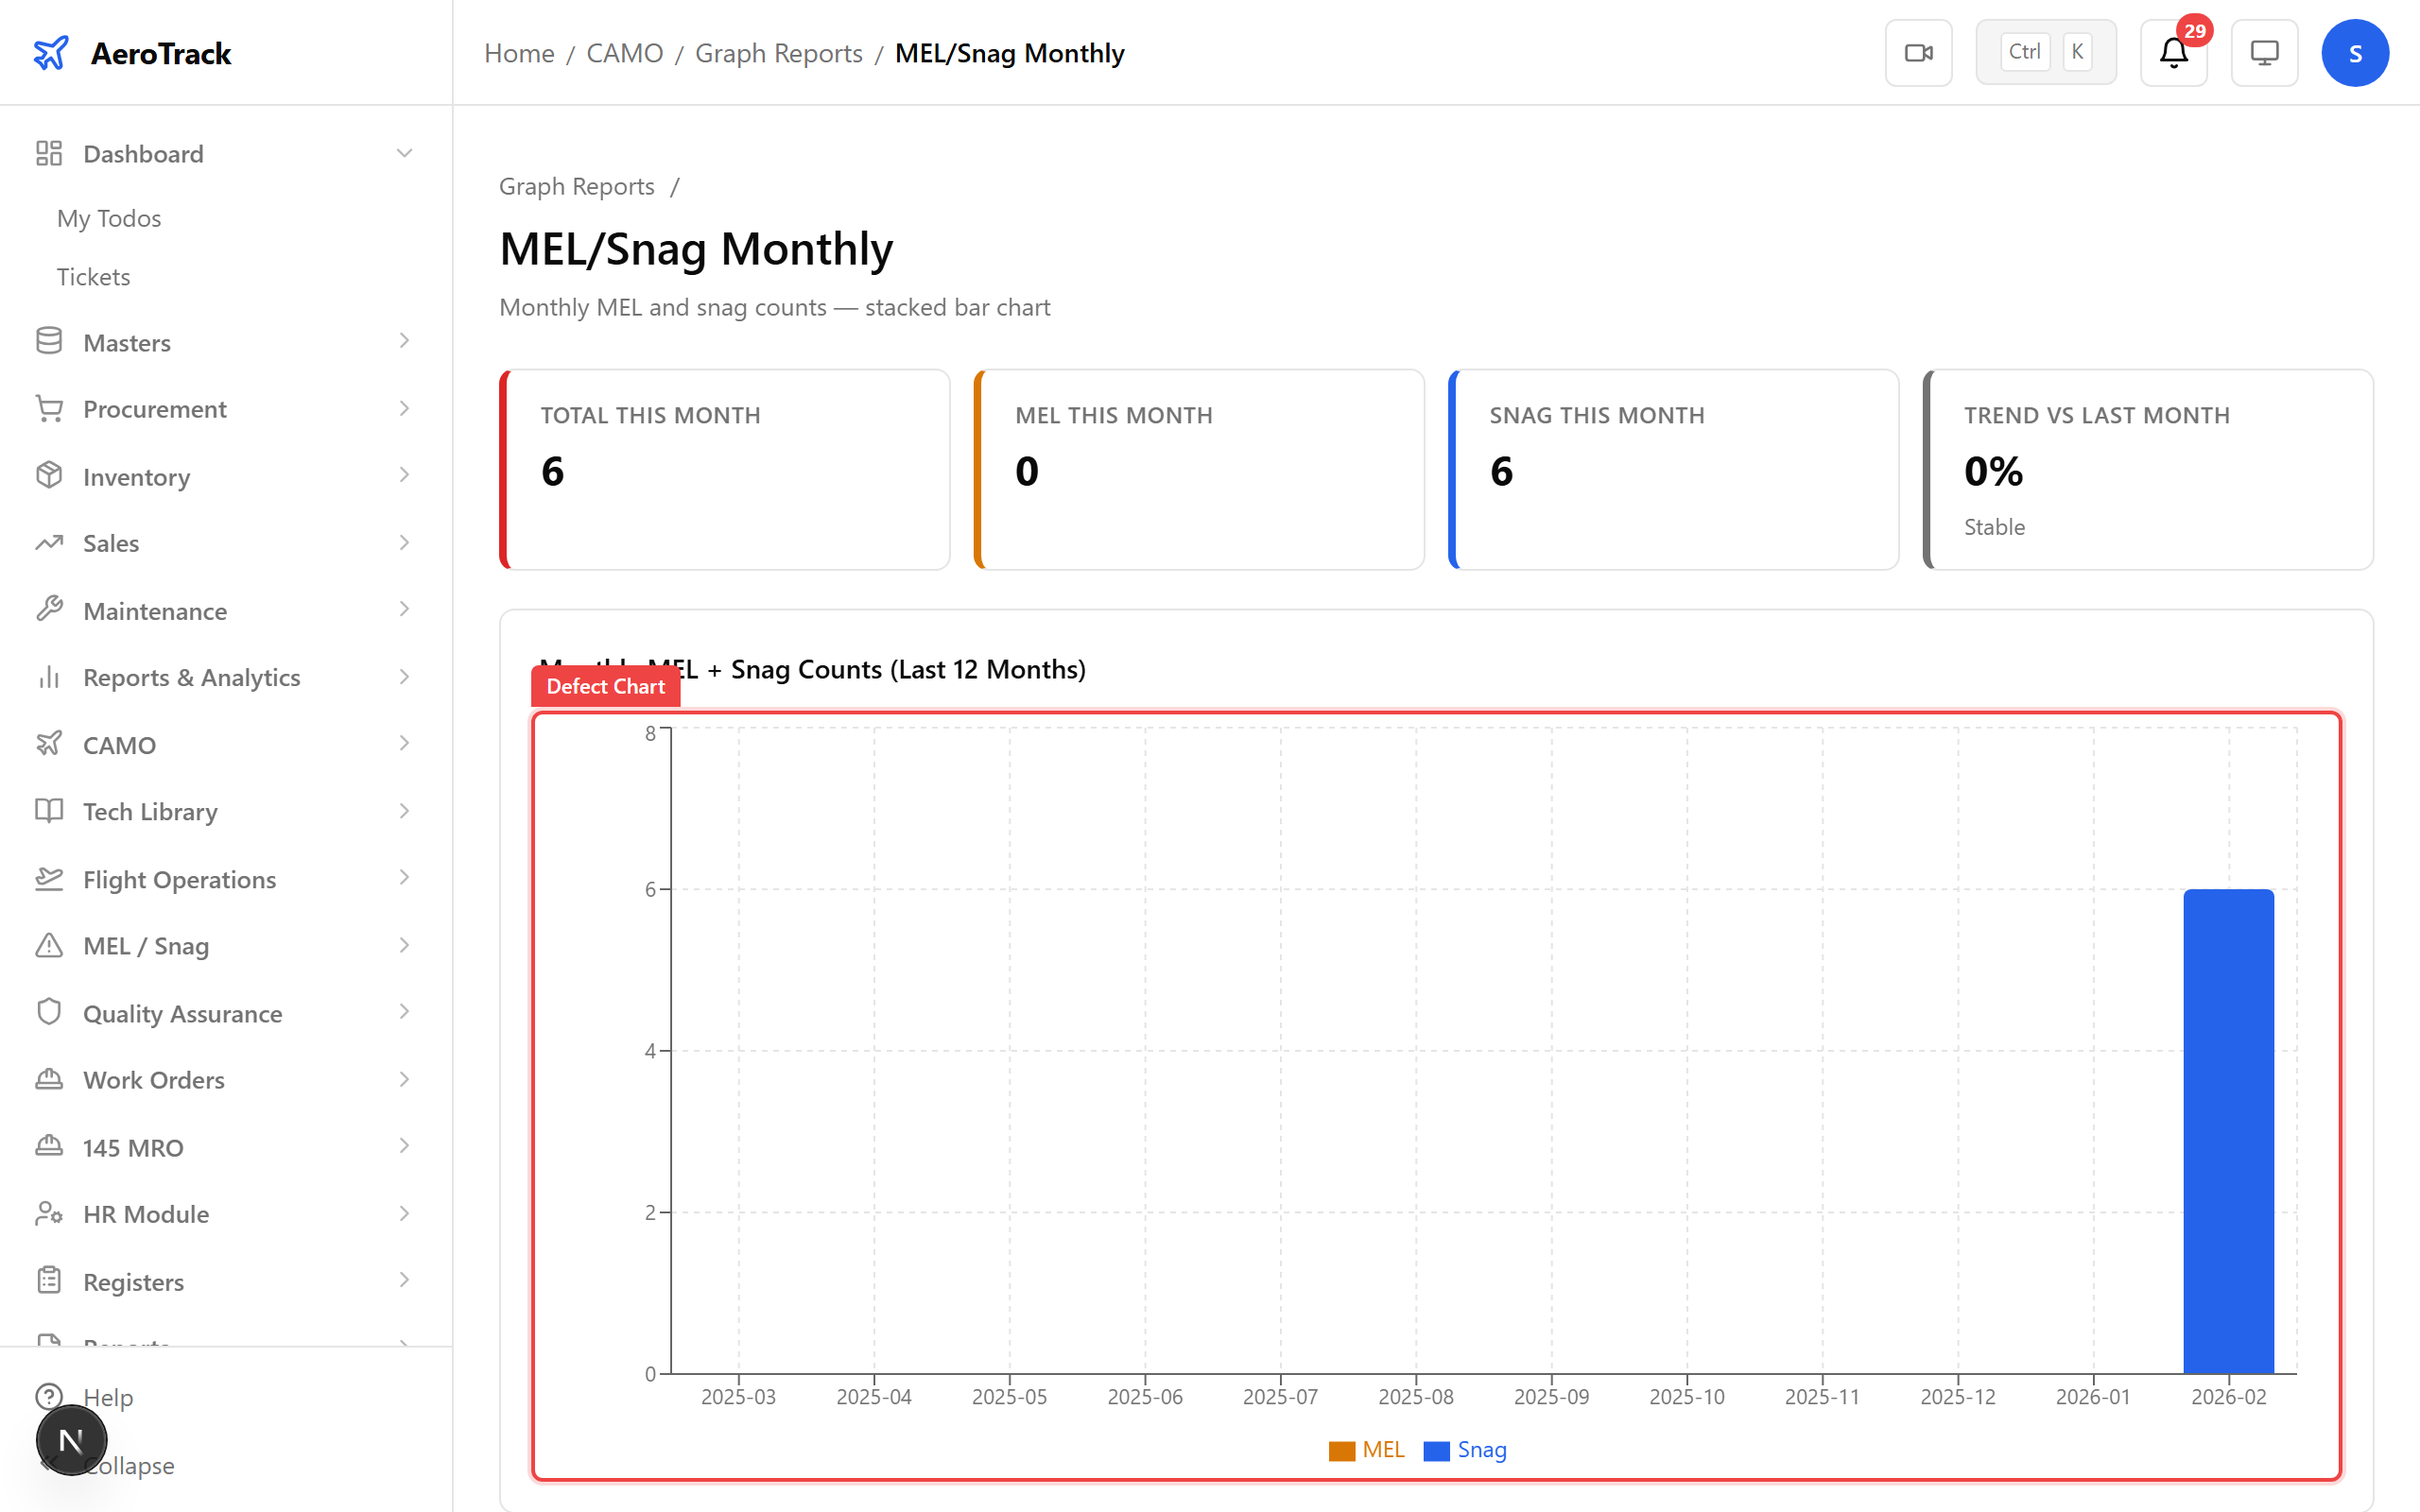
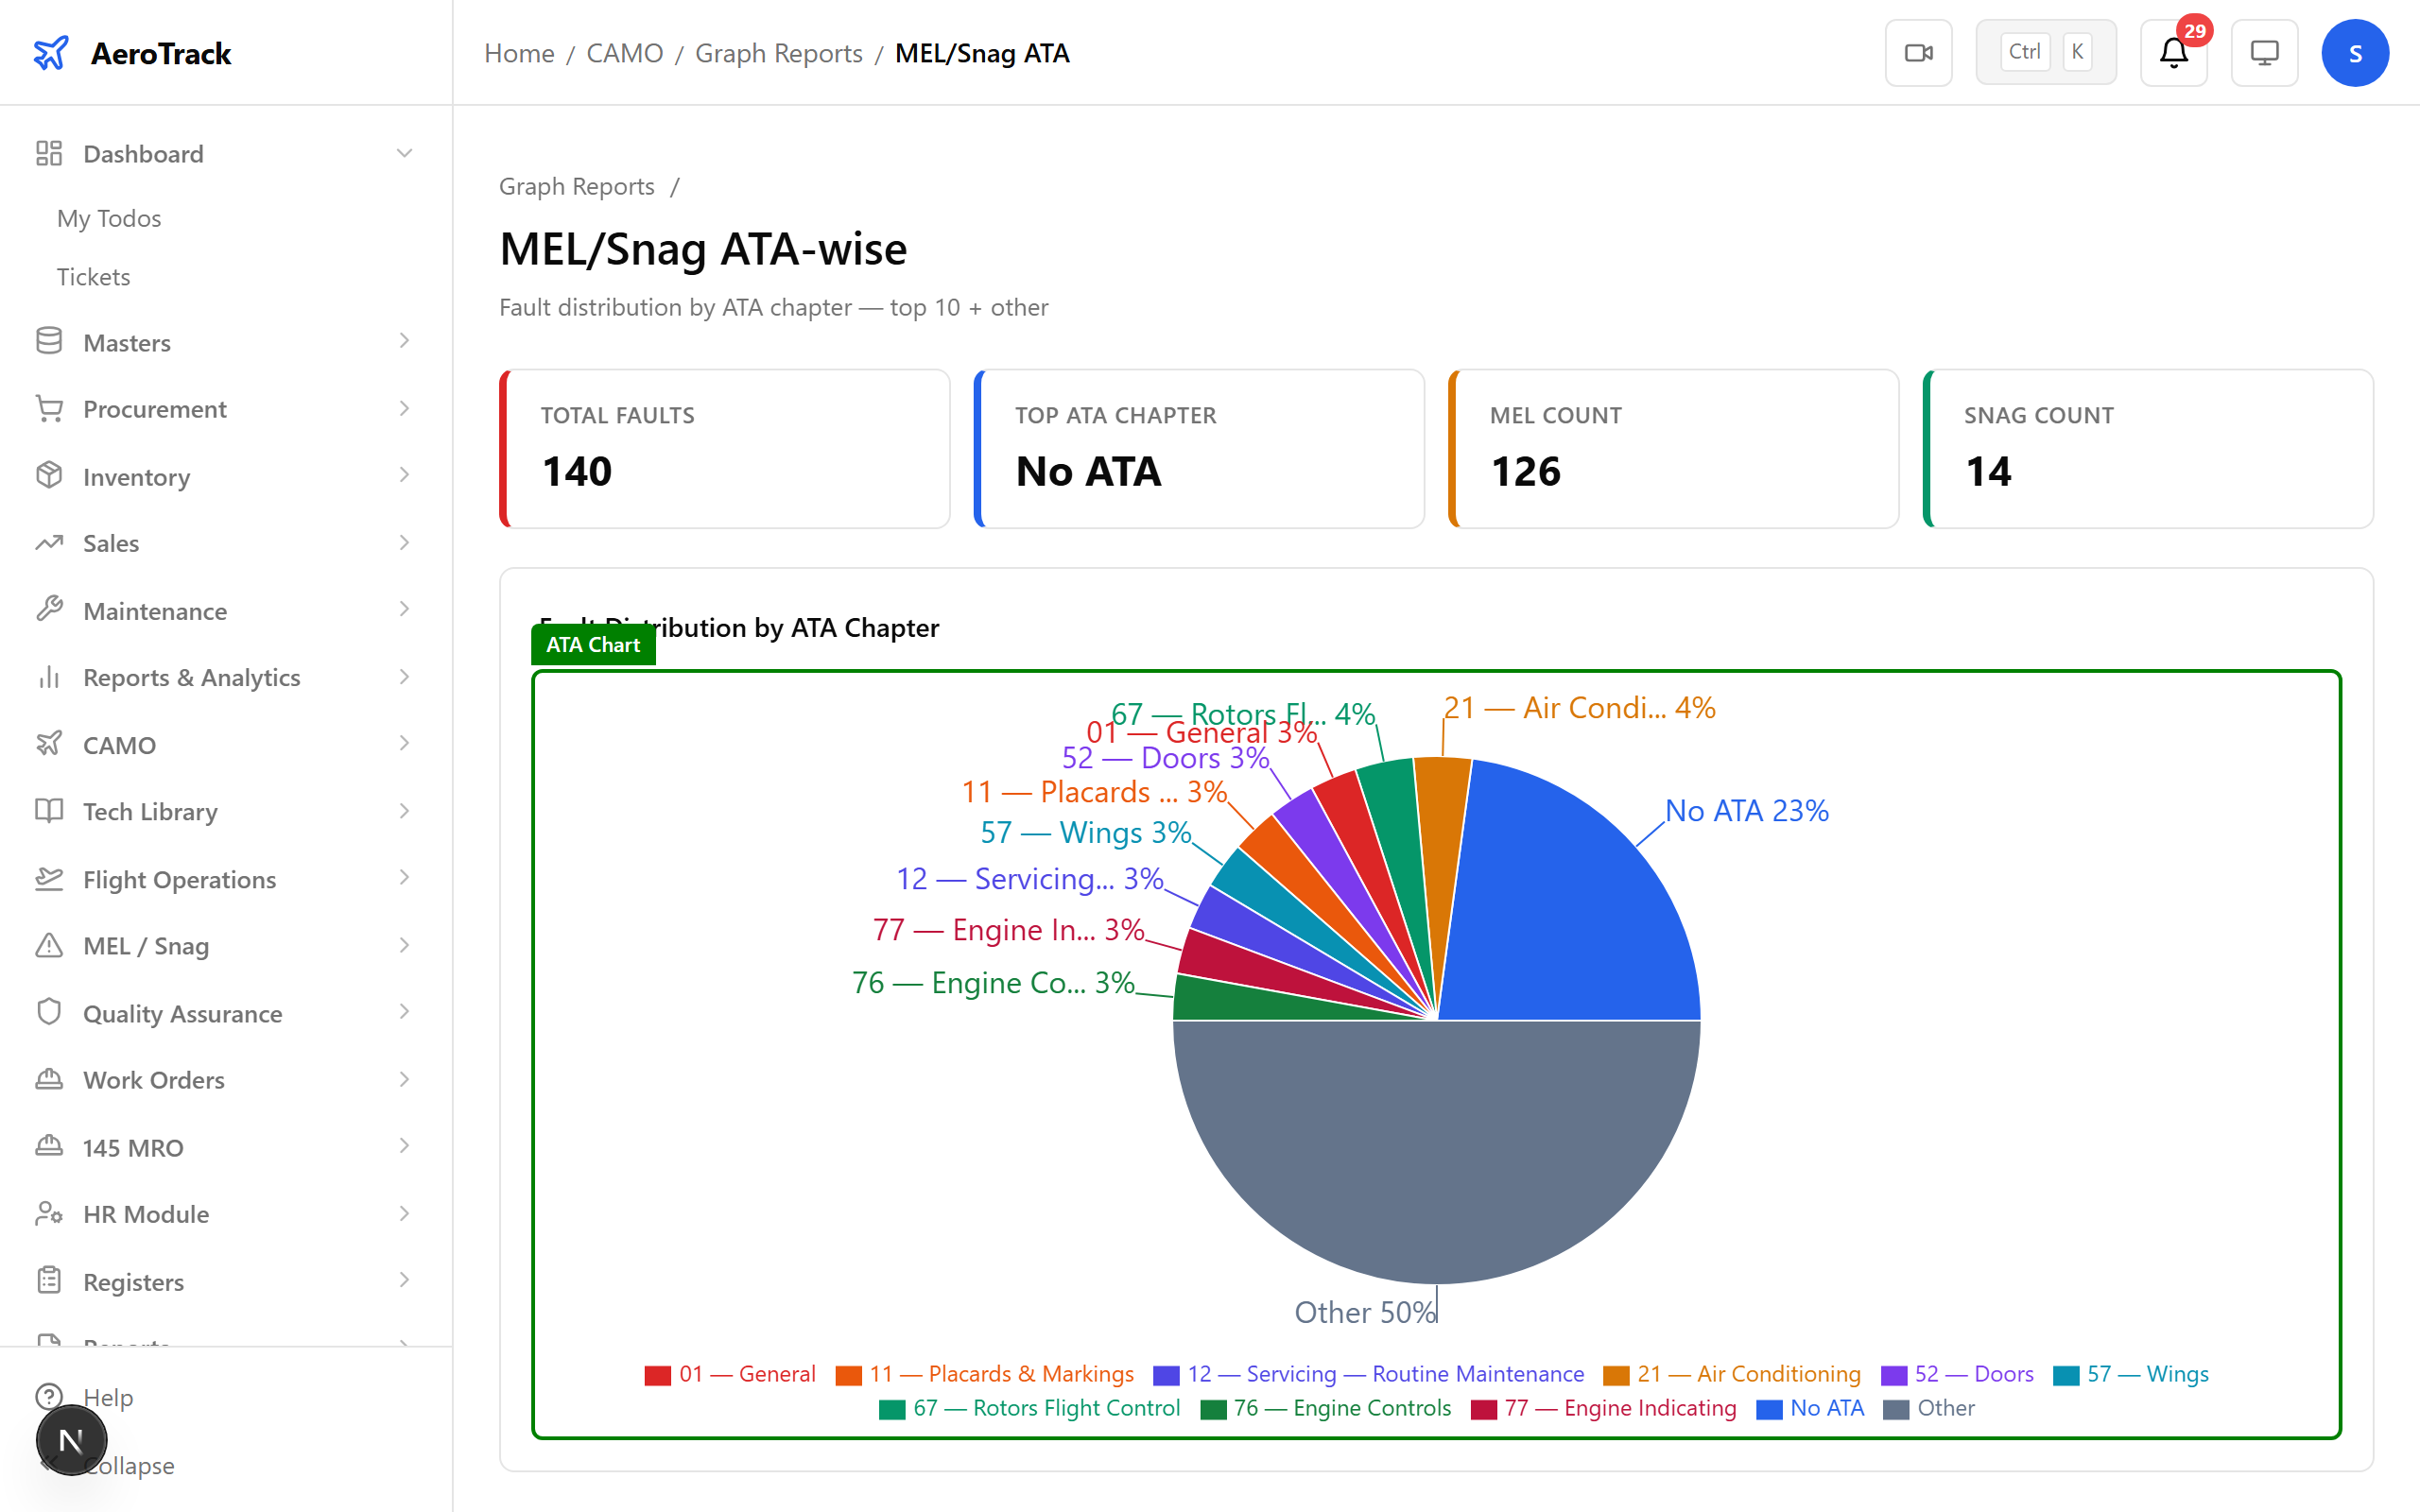
Step 7 — MEL/Snag Monthly Trends
The MEL/Snag Monthly chart shows defect rates over time — new snags, deferred MEL items, and resolution rates by month.
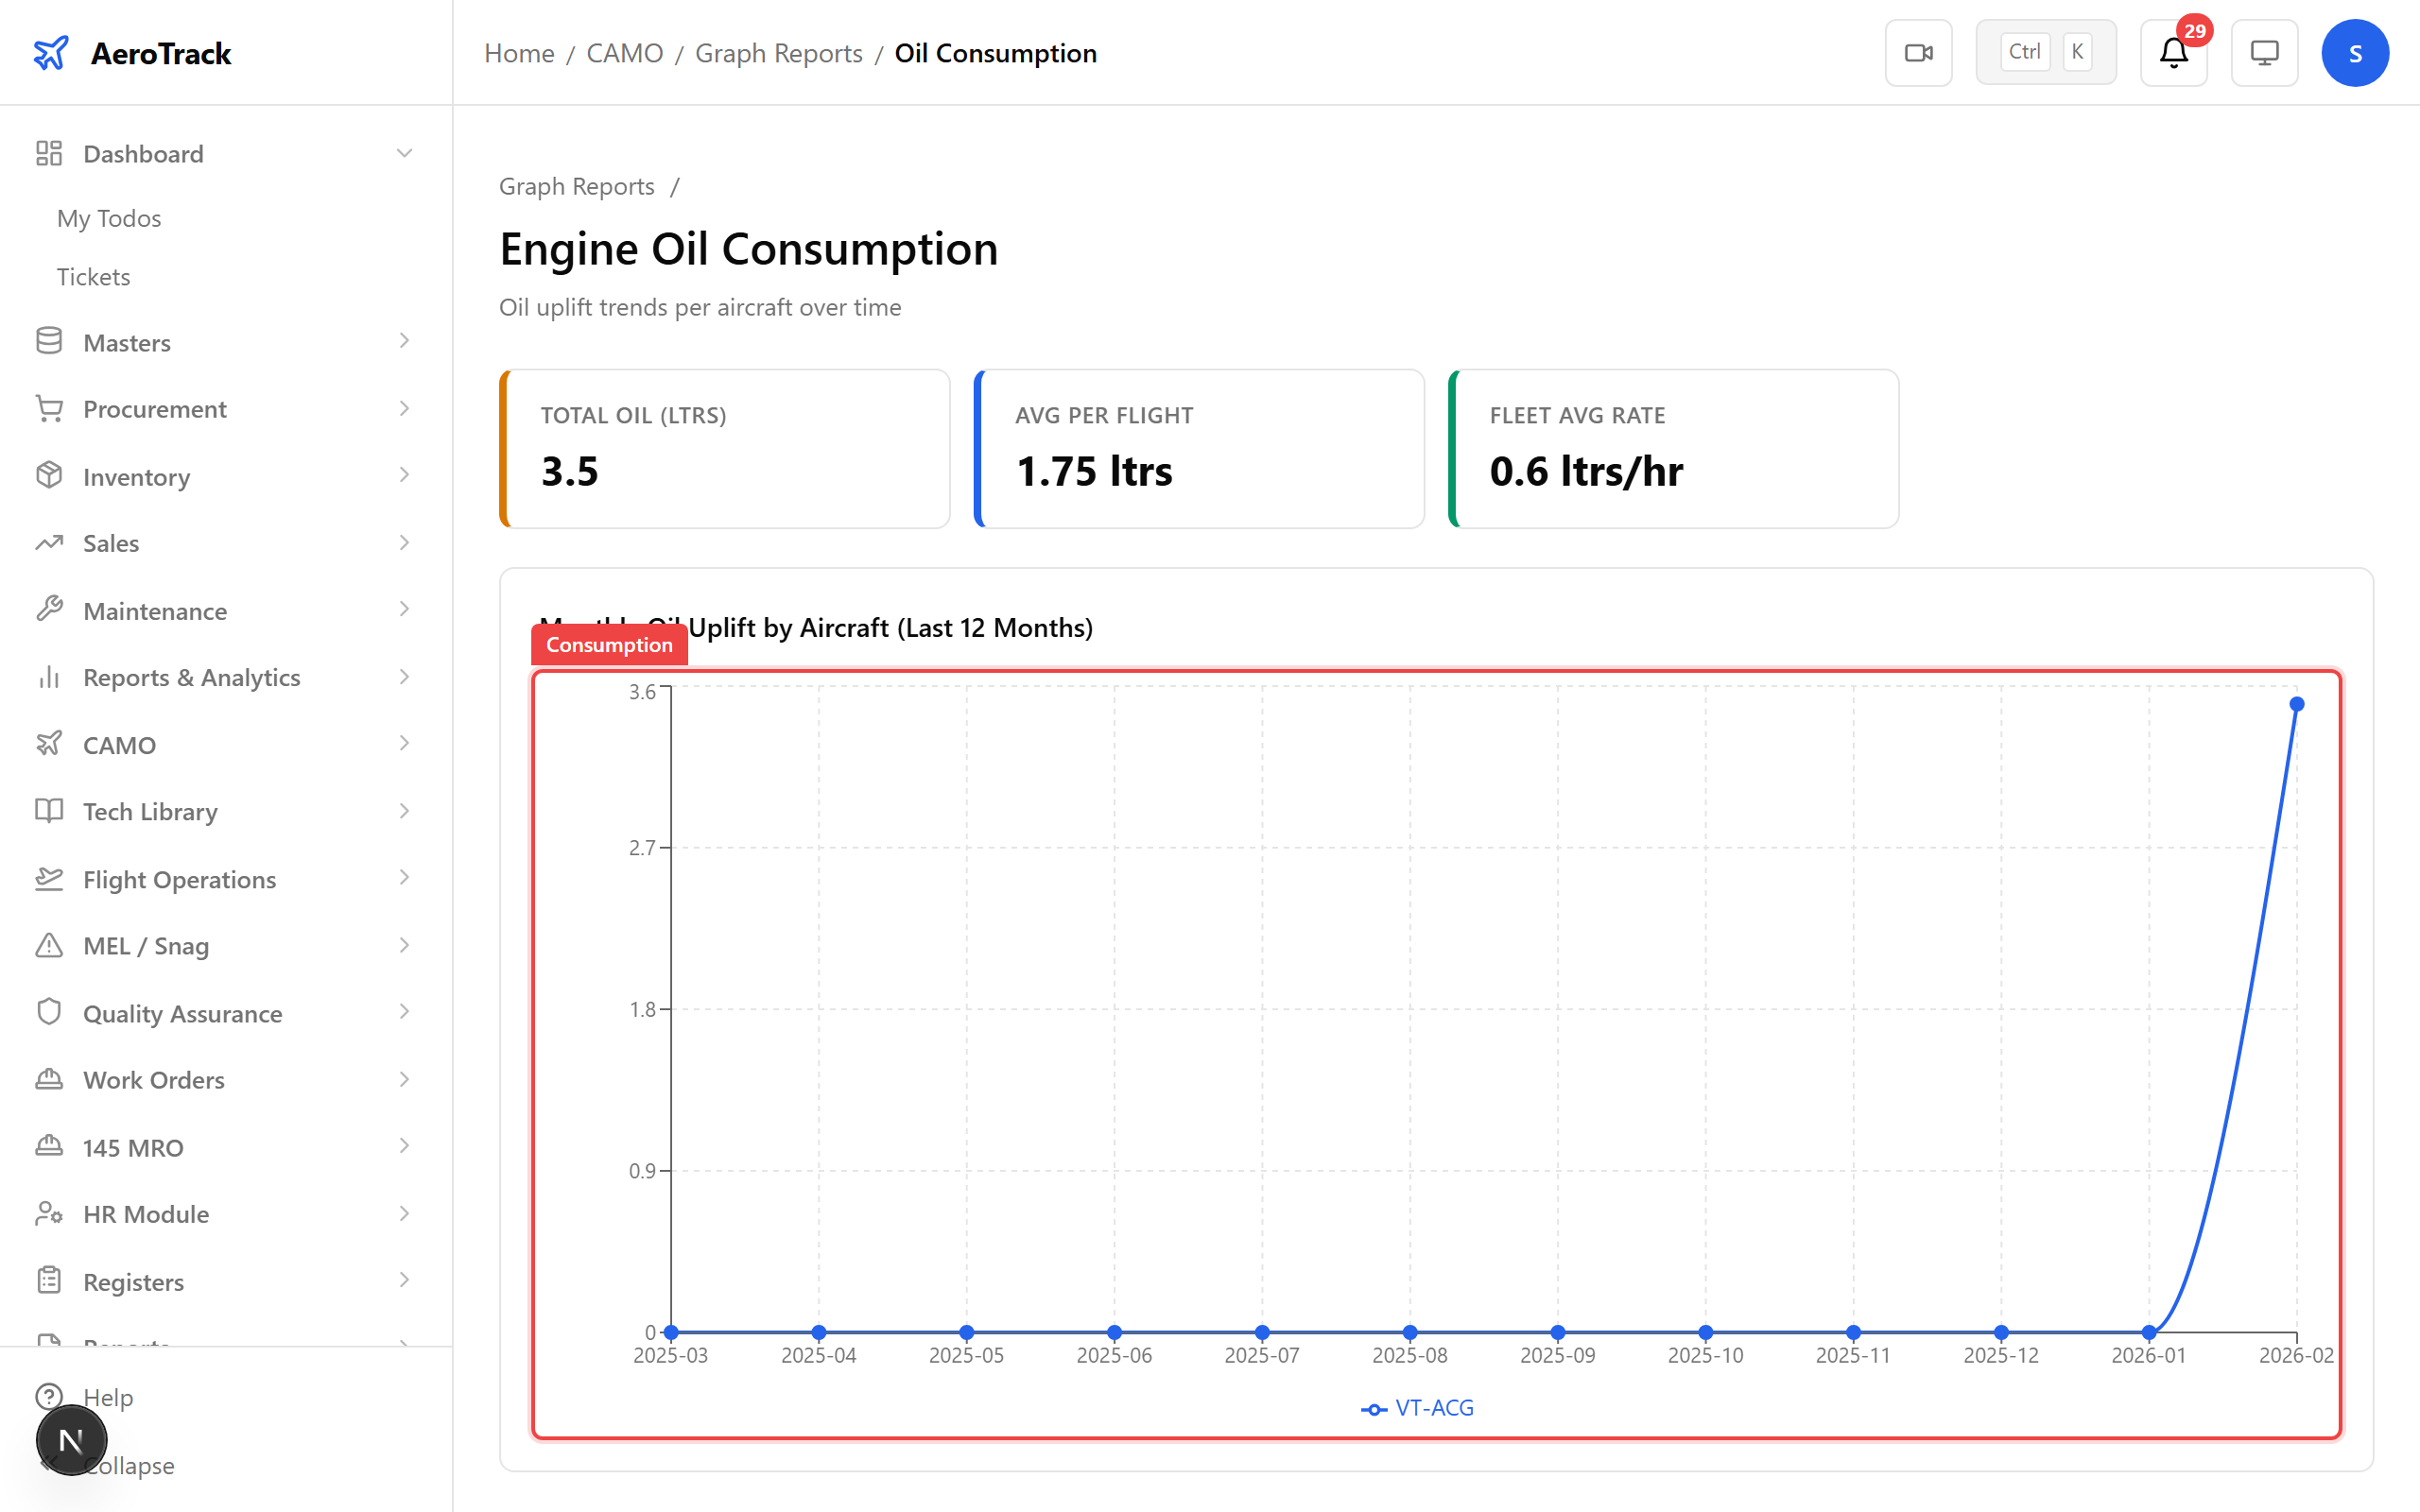
Step 8 — Oil Consumption
The Oil Consumption chart tracks oil usage by engine and aircraft — a key leading indicator for engine health and maintenance cost forecasting.
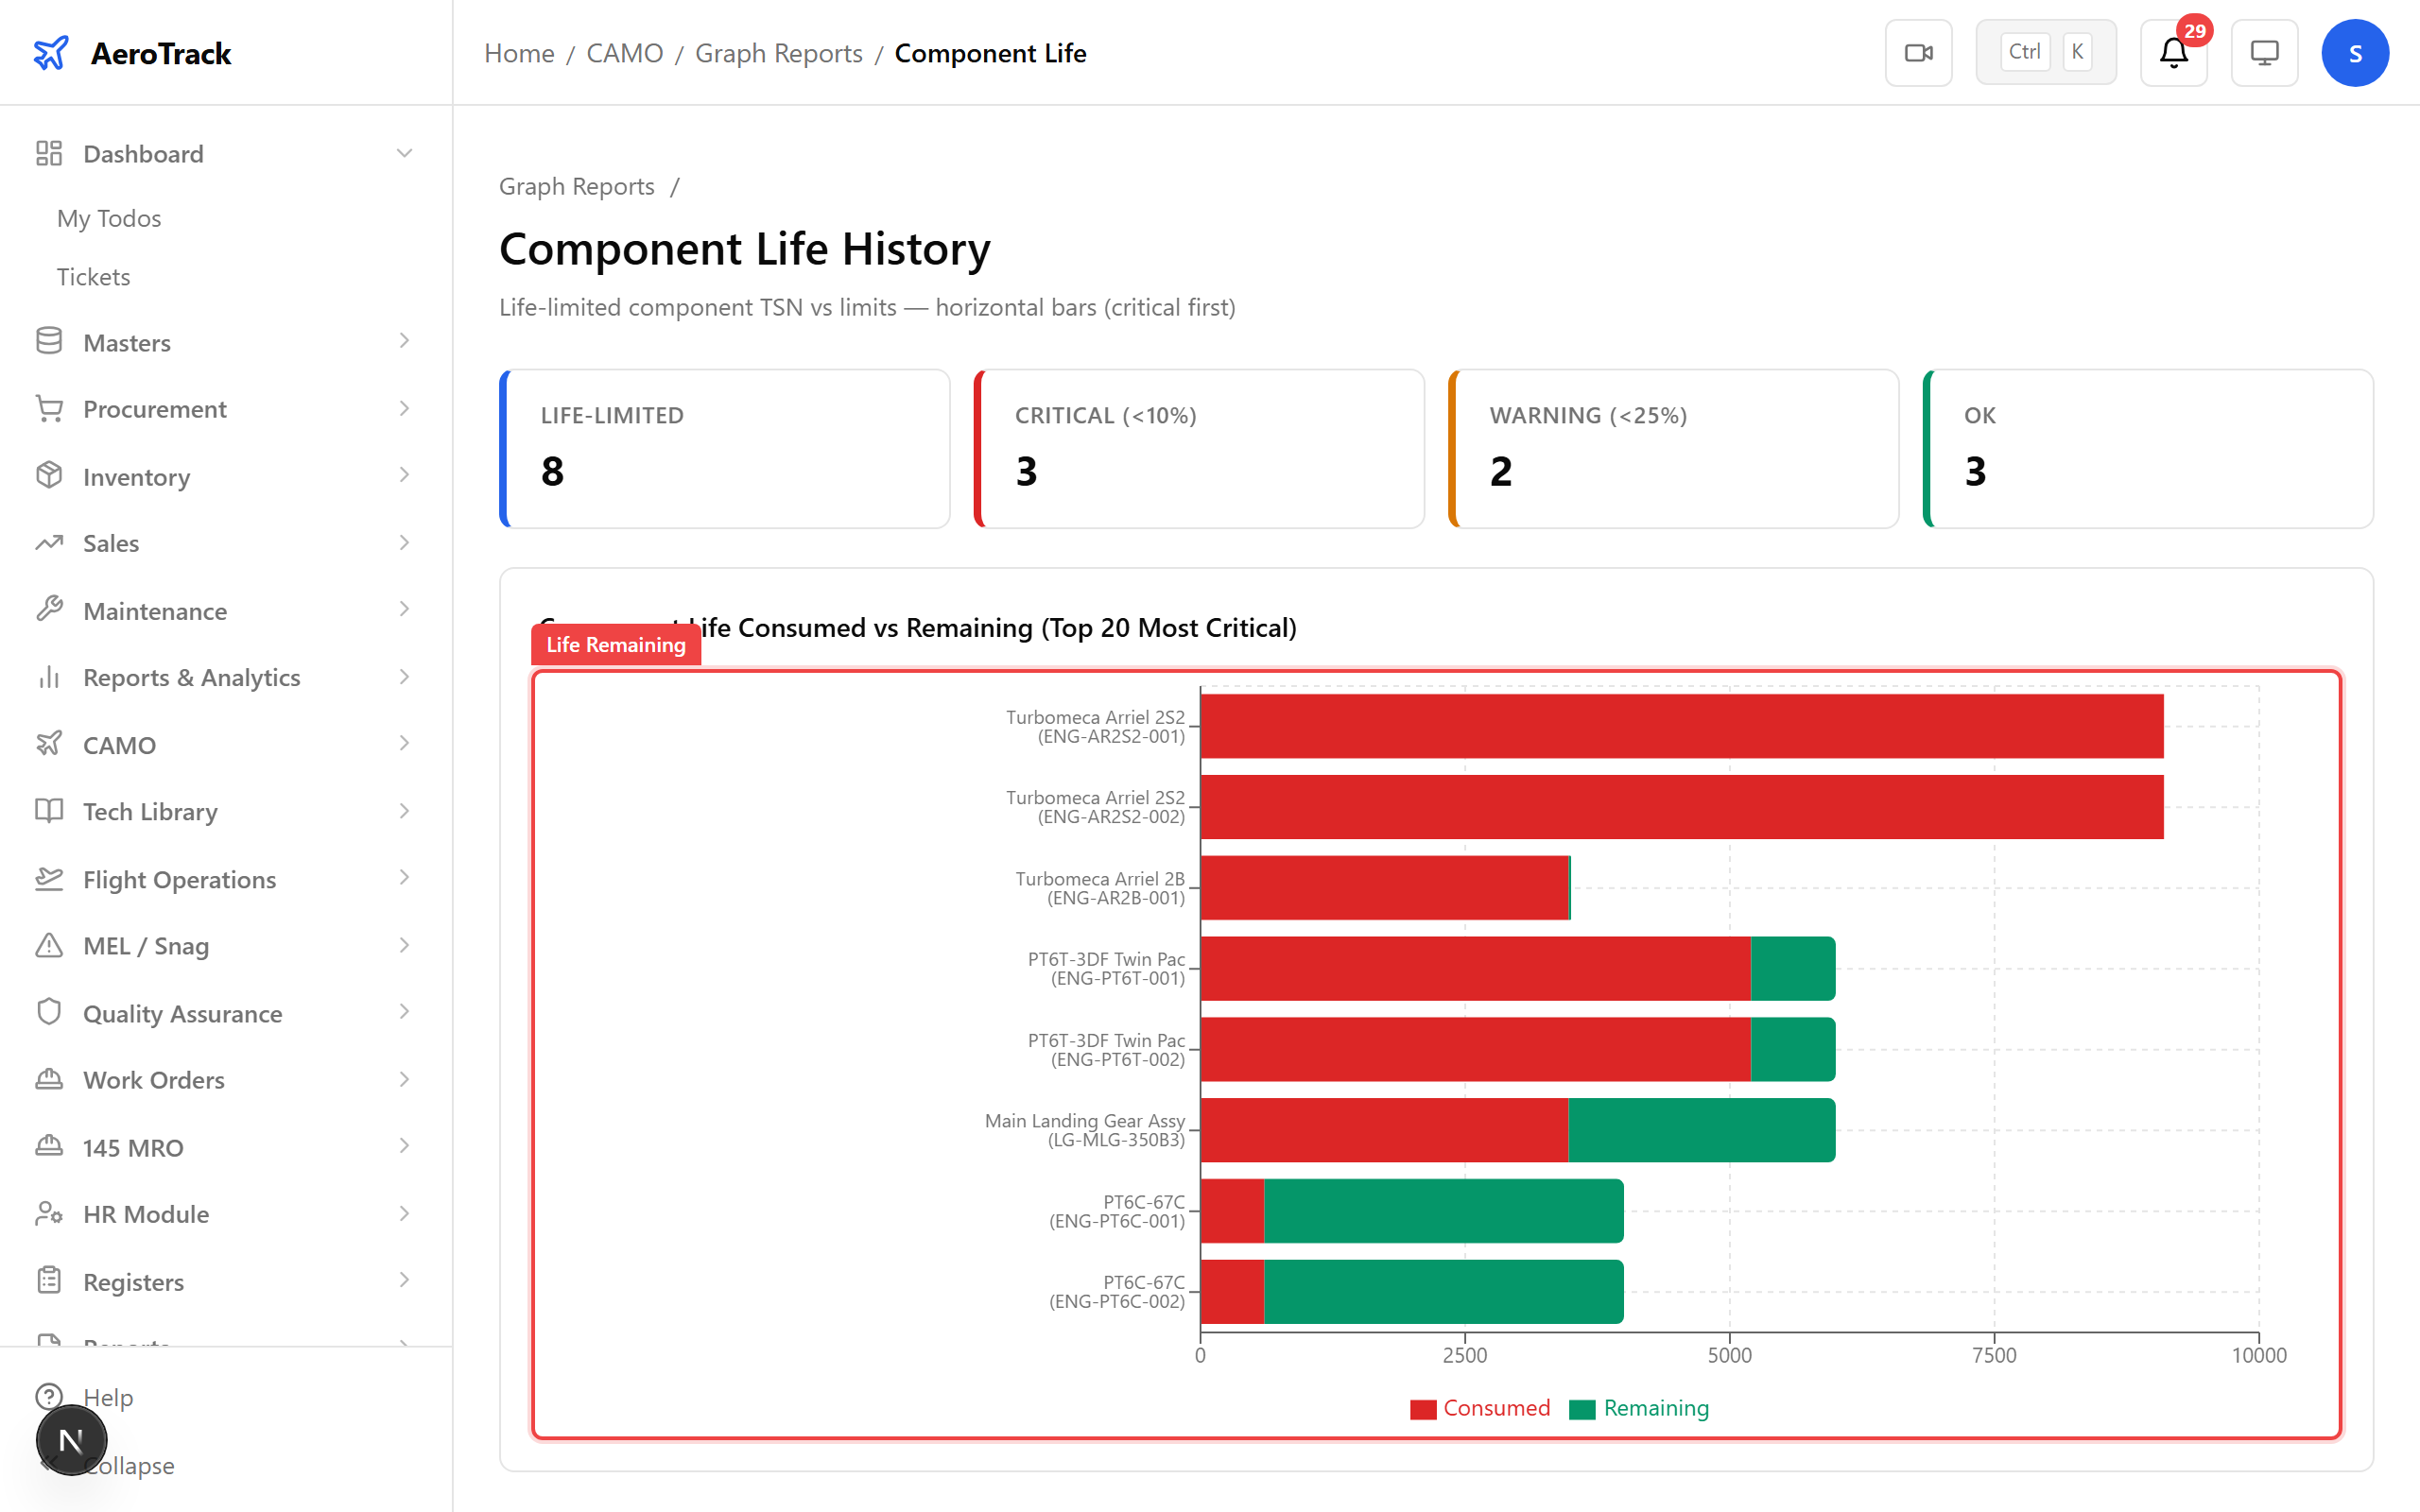
Step 9 — Component Life
The Component Life chart visualises remaining life for life-limited parts — hours, cycles, or calendar time until the next overhaul or replacement.
Step 10 — Filter Controls
Every graph supports filters. Narrow by aircraft registration, date range, ATA chapter, or component type to focus on the data that matters for your analysis.
Tip: Apply filters before management meetings to prepare aircraft-specific performance summaries.
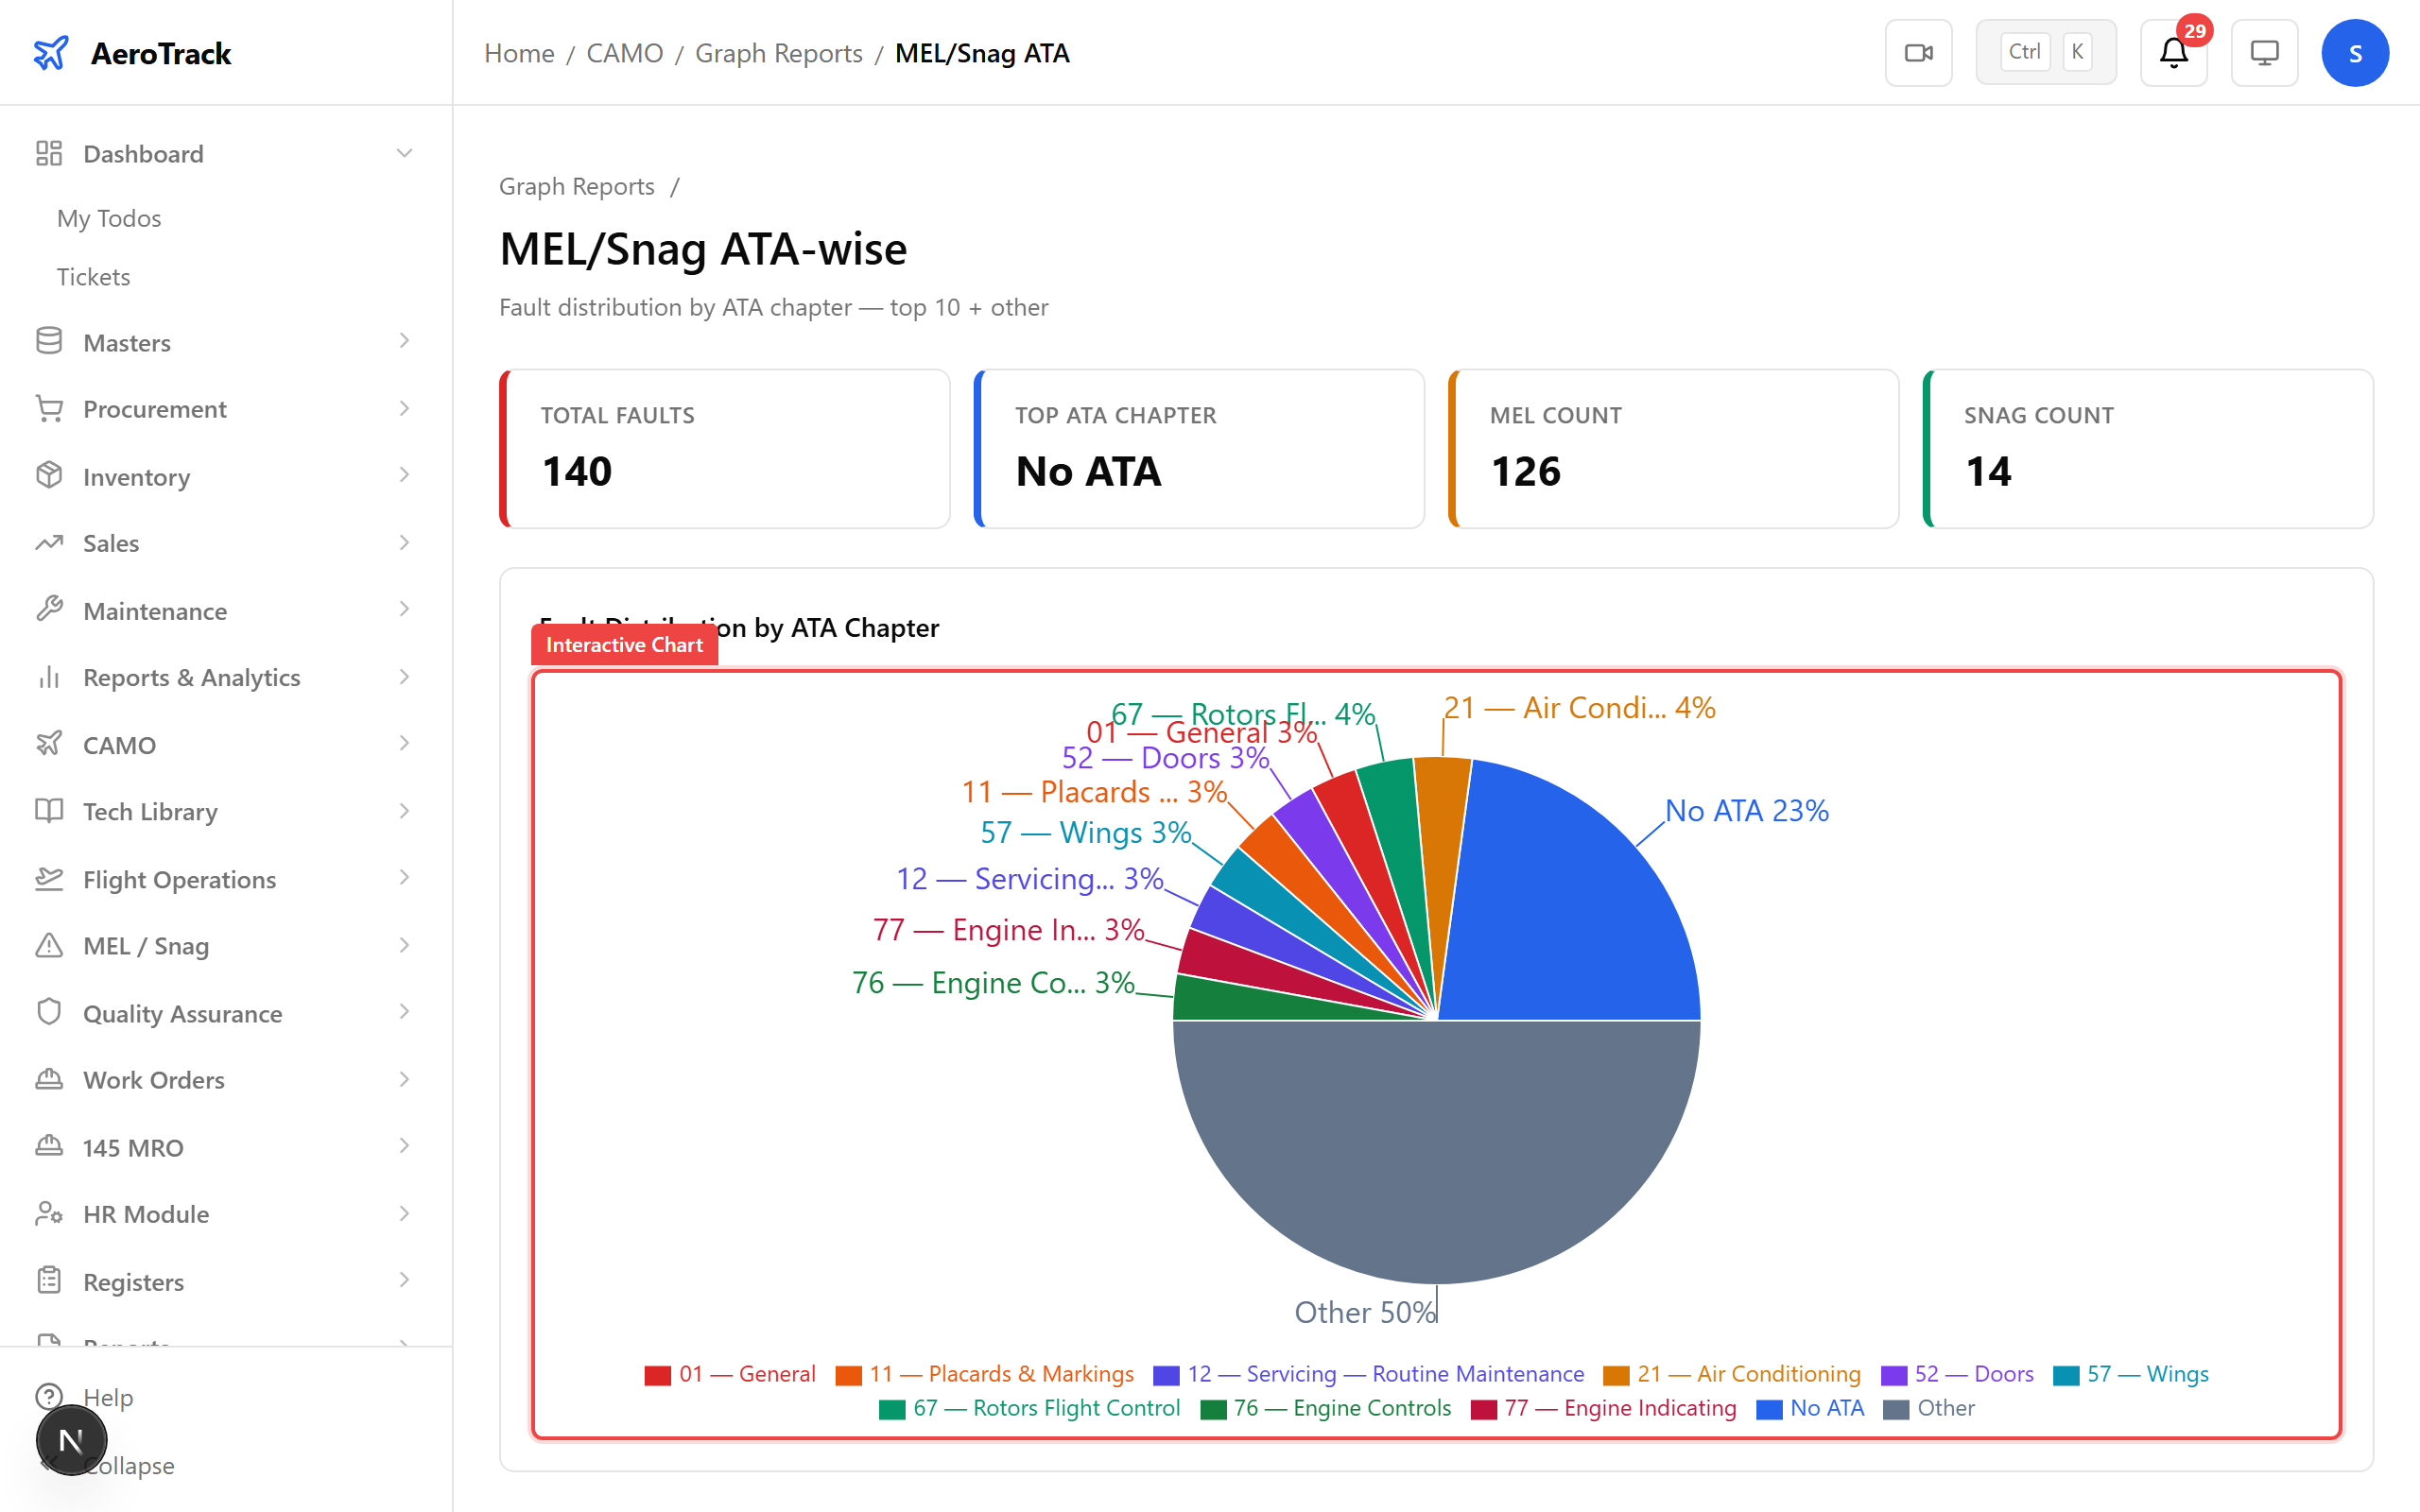
Step 11 — Interactive Charts
Hover over any data point to see detailed tooltips — exact values, dates, and breakdowns. Charts are fully interactive with zoom, pan, and drill-down capabilities.
Step 12 — Graphs Complete
That covers all 8 CAMO graph types. From fleet utilisation to component life, every chart gives you visual insight into your fleet’s performance — interactive, filterable, and always up to date.