Fleet Overview
Navigate to CAMO Graphs → Fleet Overview
or go directly to /camo/graphs/fleet-overview.
This dashboard provides a visual summary of the entire fleet
with KPI cards and a chart showing aircraft distribution.
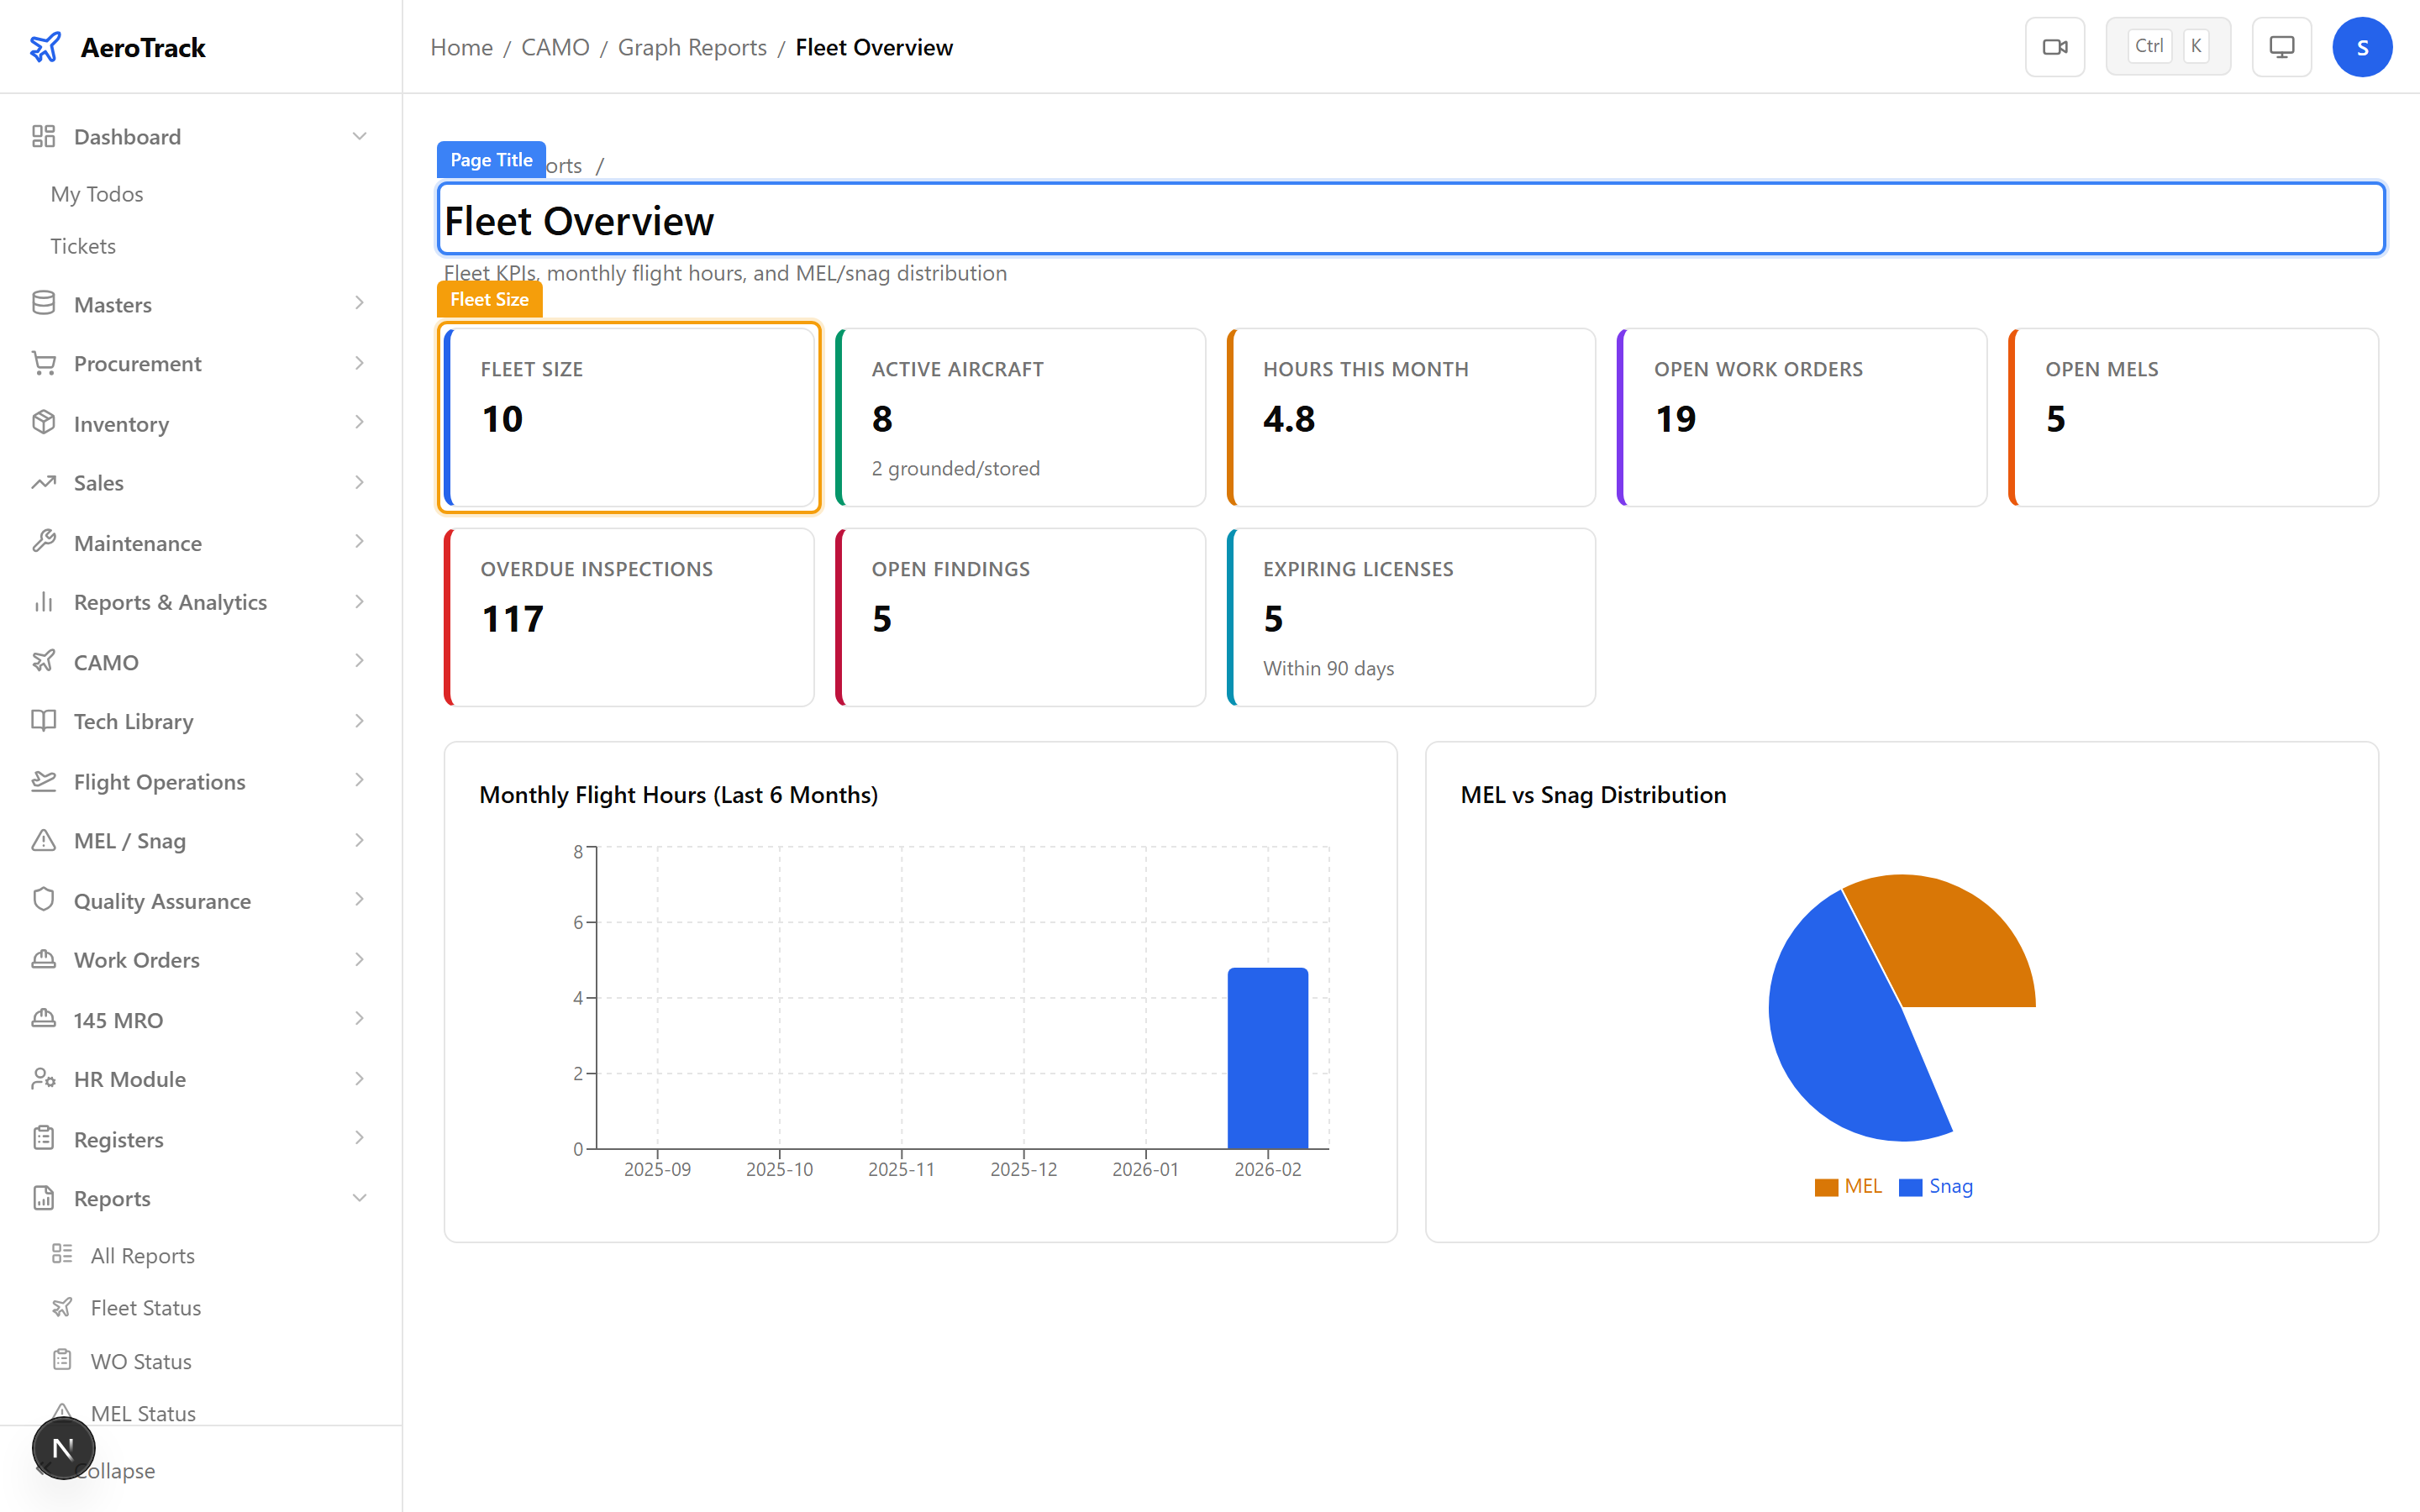
The top section shows key fleet metrics at a glance:
| KPI | Description |
|---|---|
| Total Hours | Sum of all airframe hours across the fleet. |
| This Month | Total flight hours logged in the current month. |
| Fleet Size | Number of active aircraft in the fleet. |
| Avg per Aircraft | Average total hours per aircraft. |
Flying Hours
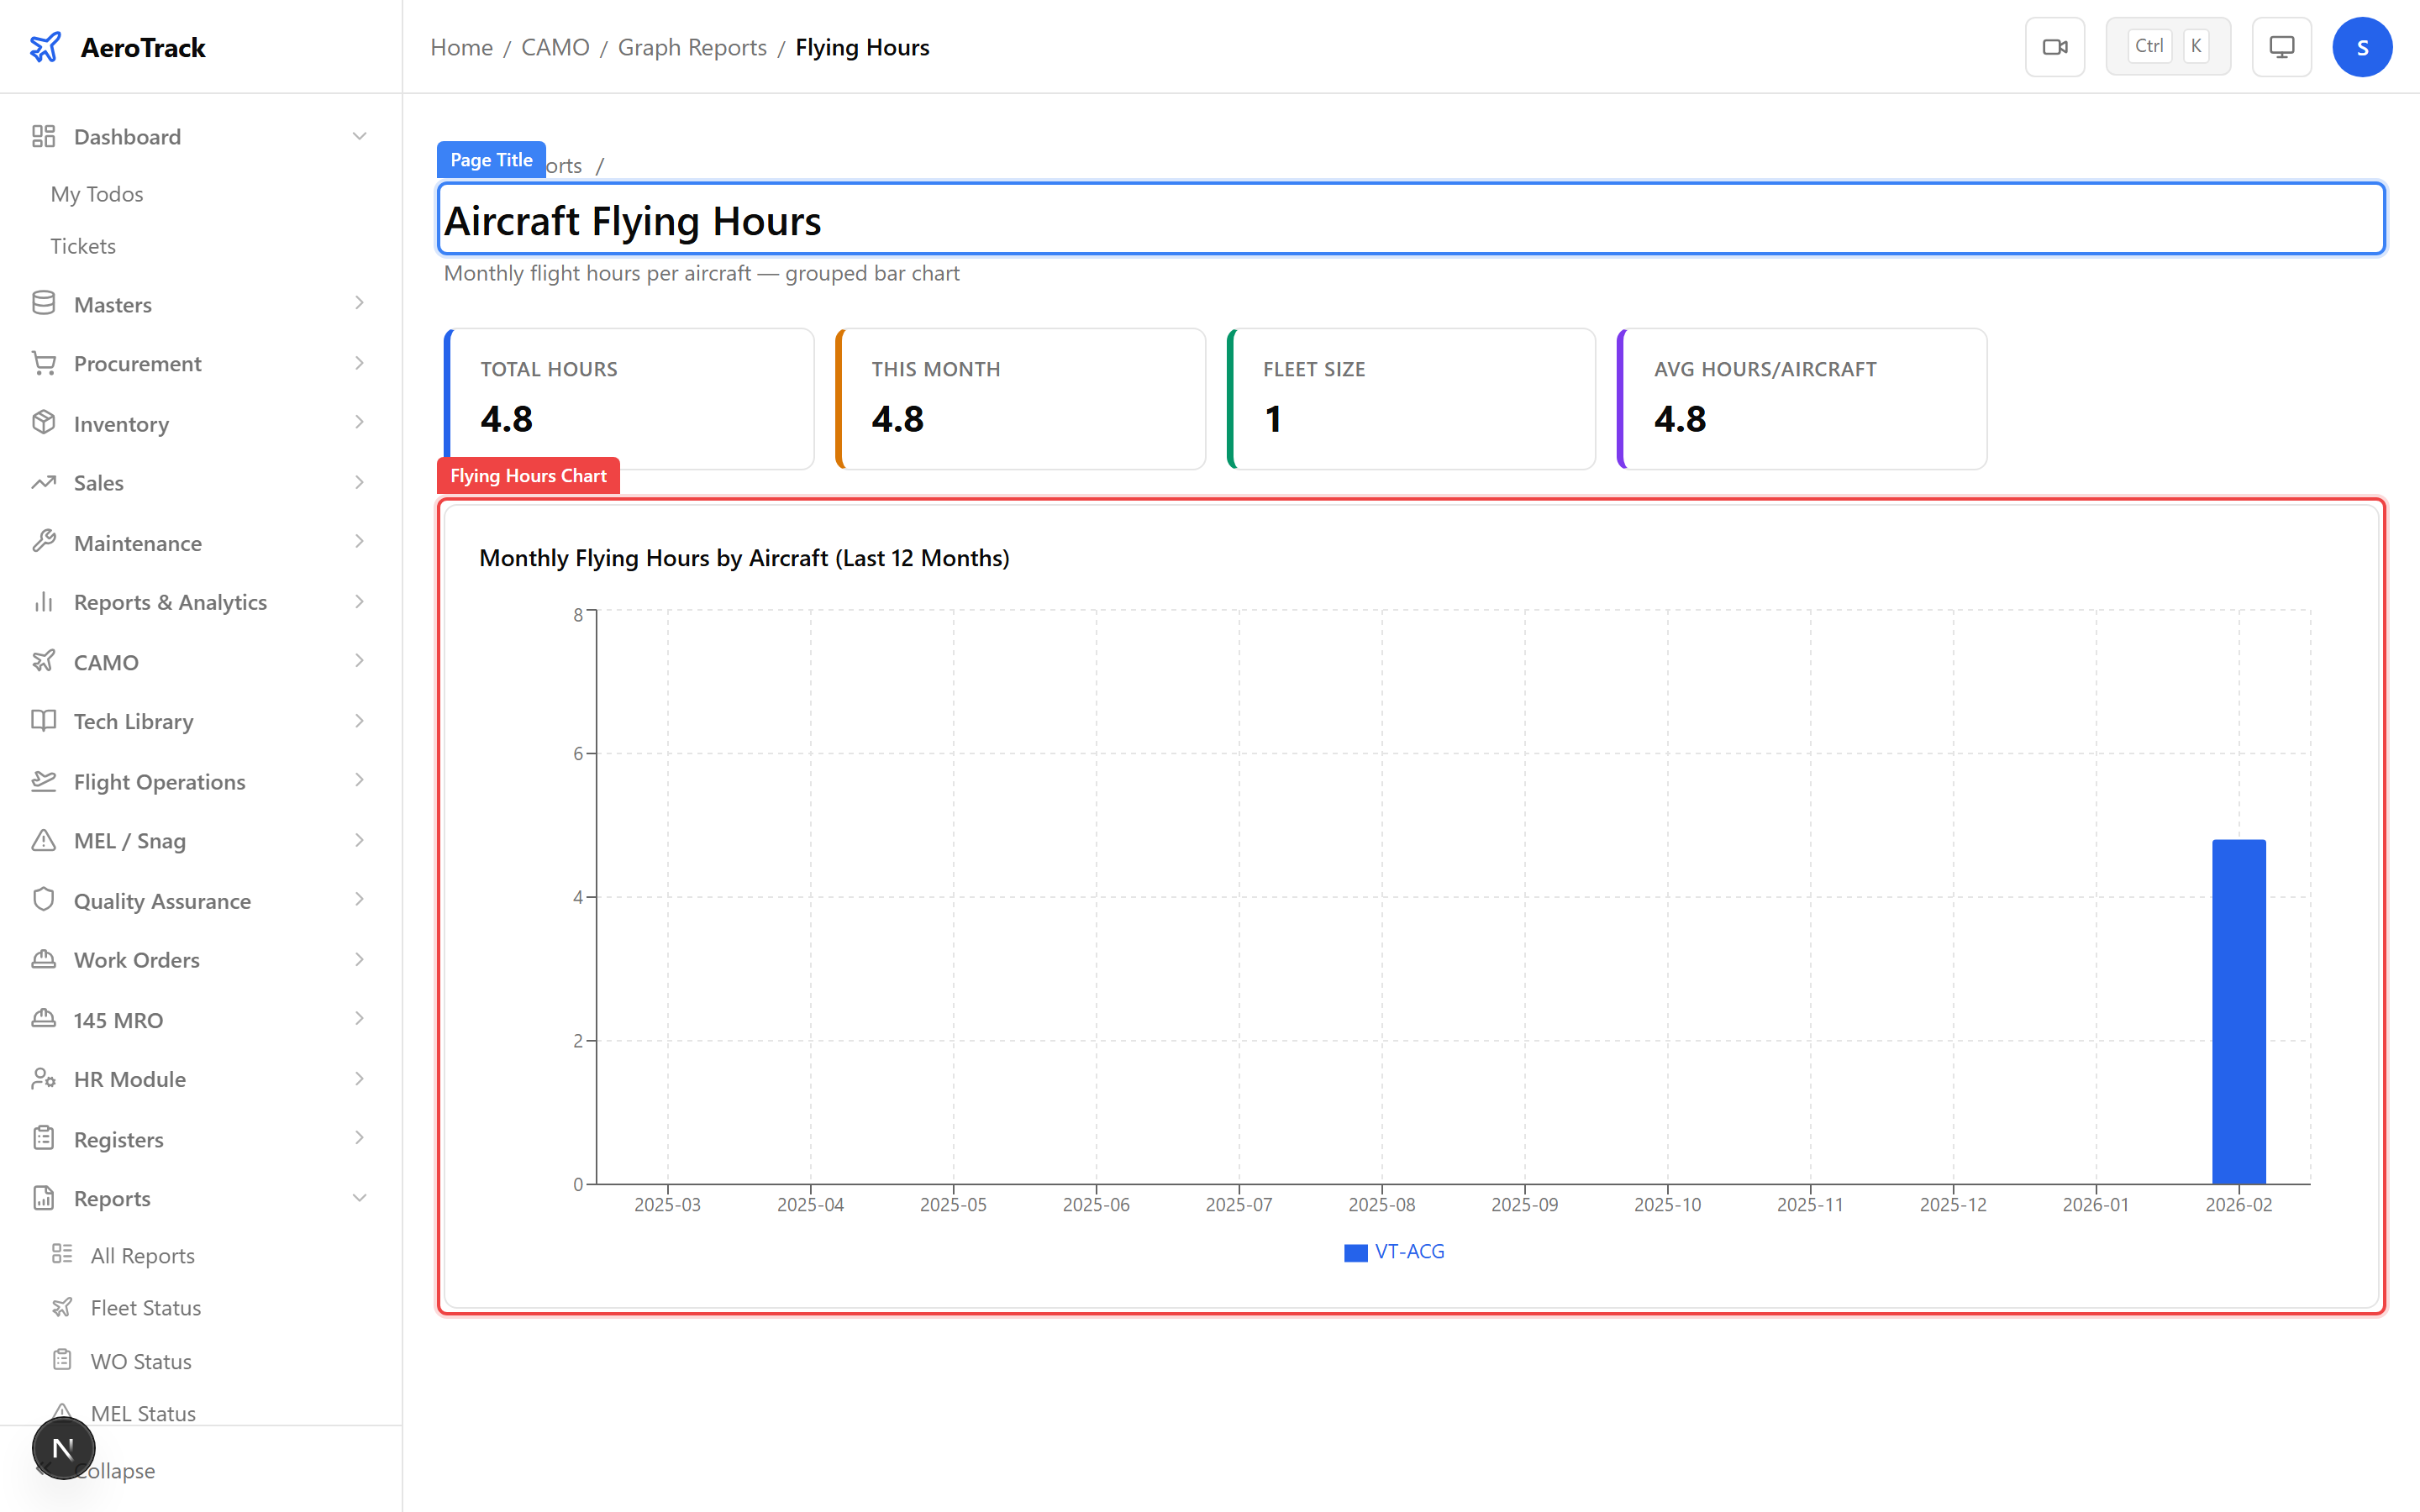
Navigate to CAMO Graphs → Flying Hours
(/camo/graphs/flying-hours). This chart plots
monthly flying hours per aircraft as a bar or line chart,
allowing trend analysis over time.
Each aircraft is shown as a separate series with a distinct colour. Hover over any data point to see the exact value in a tooltip.
Utilisation
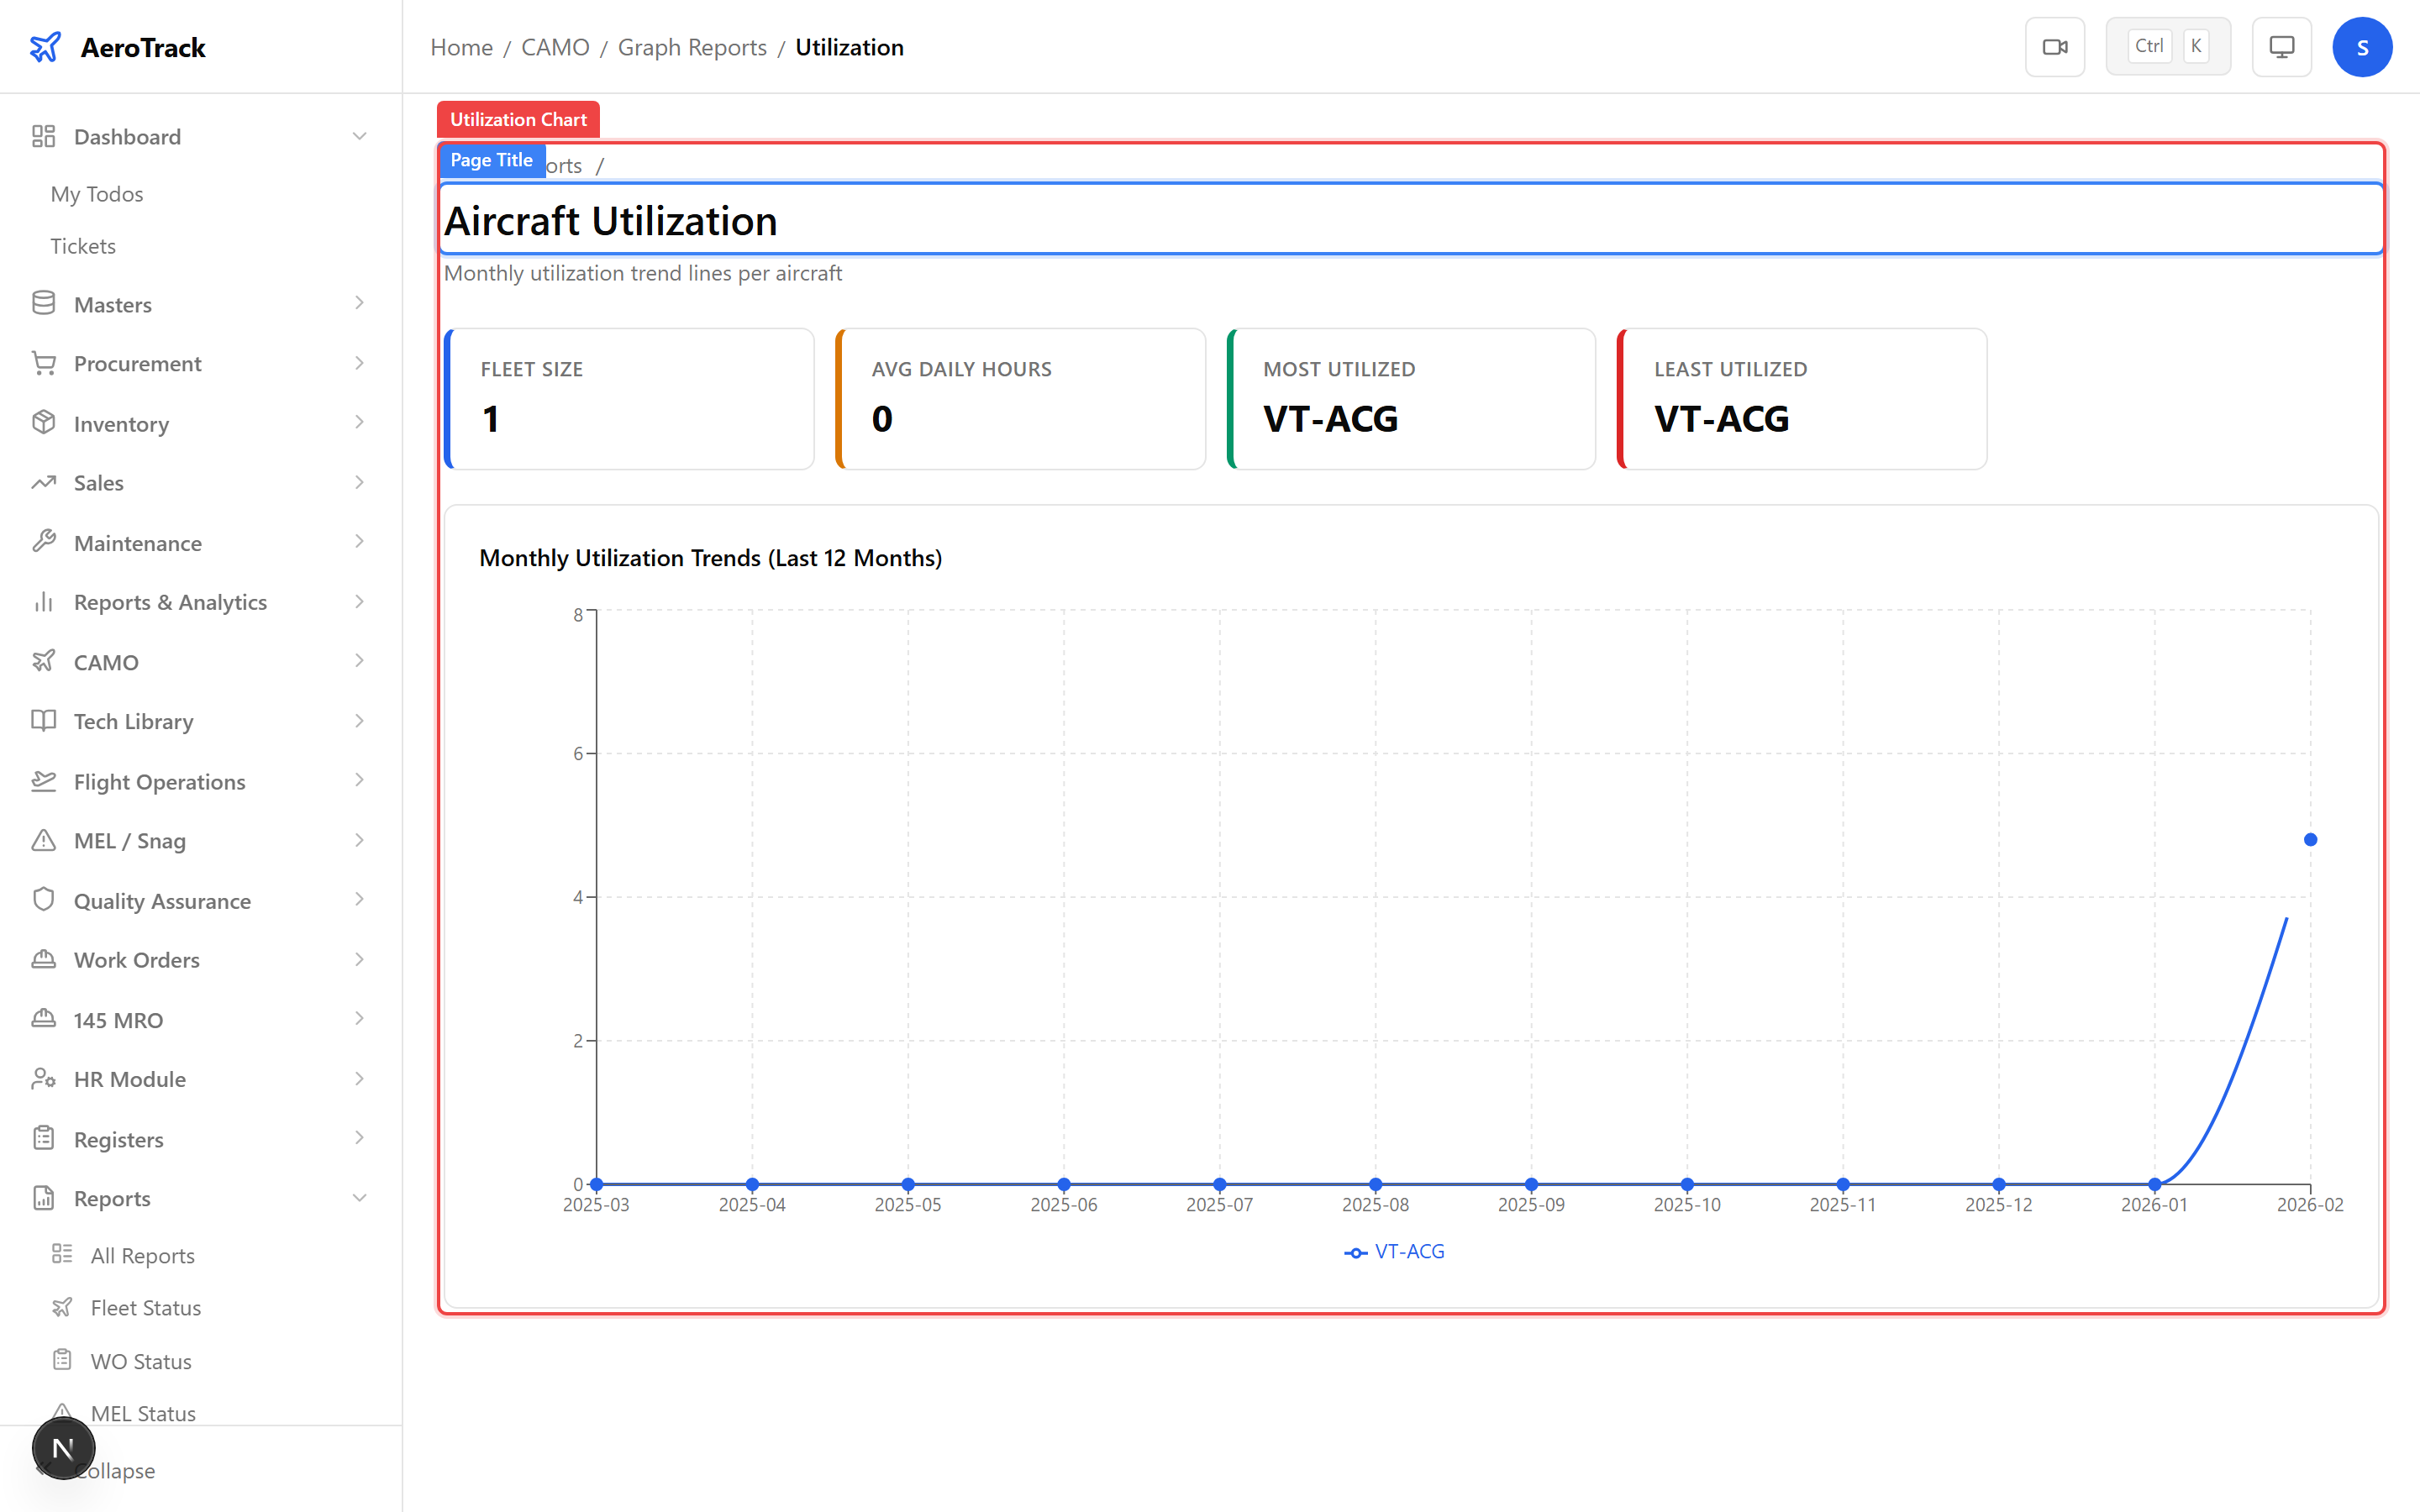
Navigate to CAMO Graphs → Utilization
(/camo/graphs/utilization). This chart shows the
utilisation rate for each aircraft — typically displayed as
a percentage or comparative bar showing hours flown vs. available
hours.
More Charts
Navigate to /camo/graphs/hours-classification. This
chart breaks down flight hours by category — revenue flights,
training, ferry, test, etc. Use it to understand how the fleet’s
available hours are distributed across operational categories.
Navigate to /camo/graphs/log-parameters. This chart
visualises operational parameters recorded in flight logs —
fuel consumption trends, oil usage, and engine parameters over
time. Use it to identify anomalies or degradation patterns.
All CAMO Graphs are interactive and share common controls:
| Interaction | Description |
|---|---|
| Hover | Shows a tooltip with the exact value for the data point. |
| Legend Click | Toggles individual series on/off to focus on specific aircraft. |
| Responsive | Charts resize automatically with the browser window. |
/camo/graphs/component-life.