Dashboard Overview
Navigate to Flight Operations → Dashboard
in the sidebar. The dashboard loads at
/flight-ops/dashboard showing real-time KPI cards
for the current month.
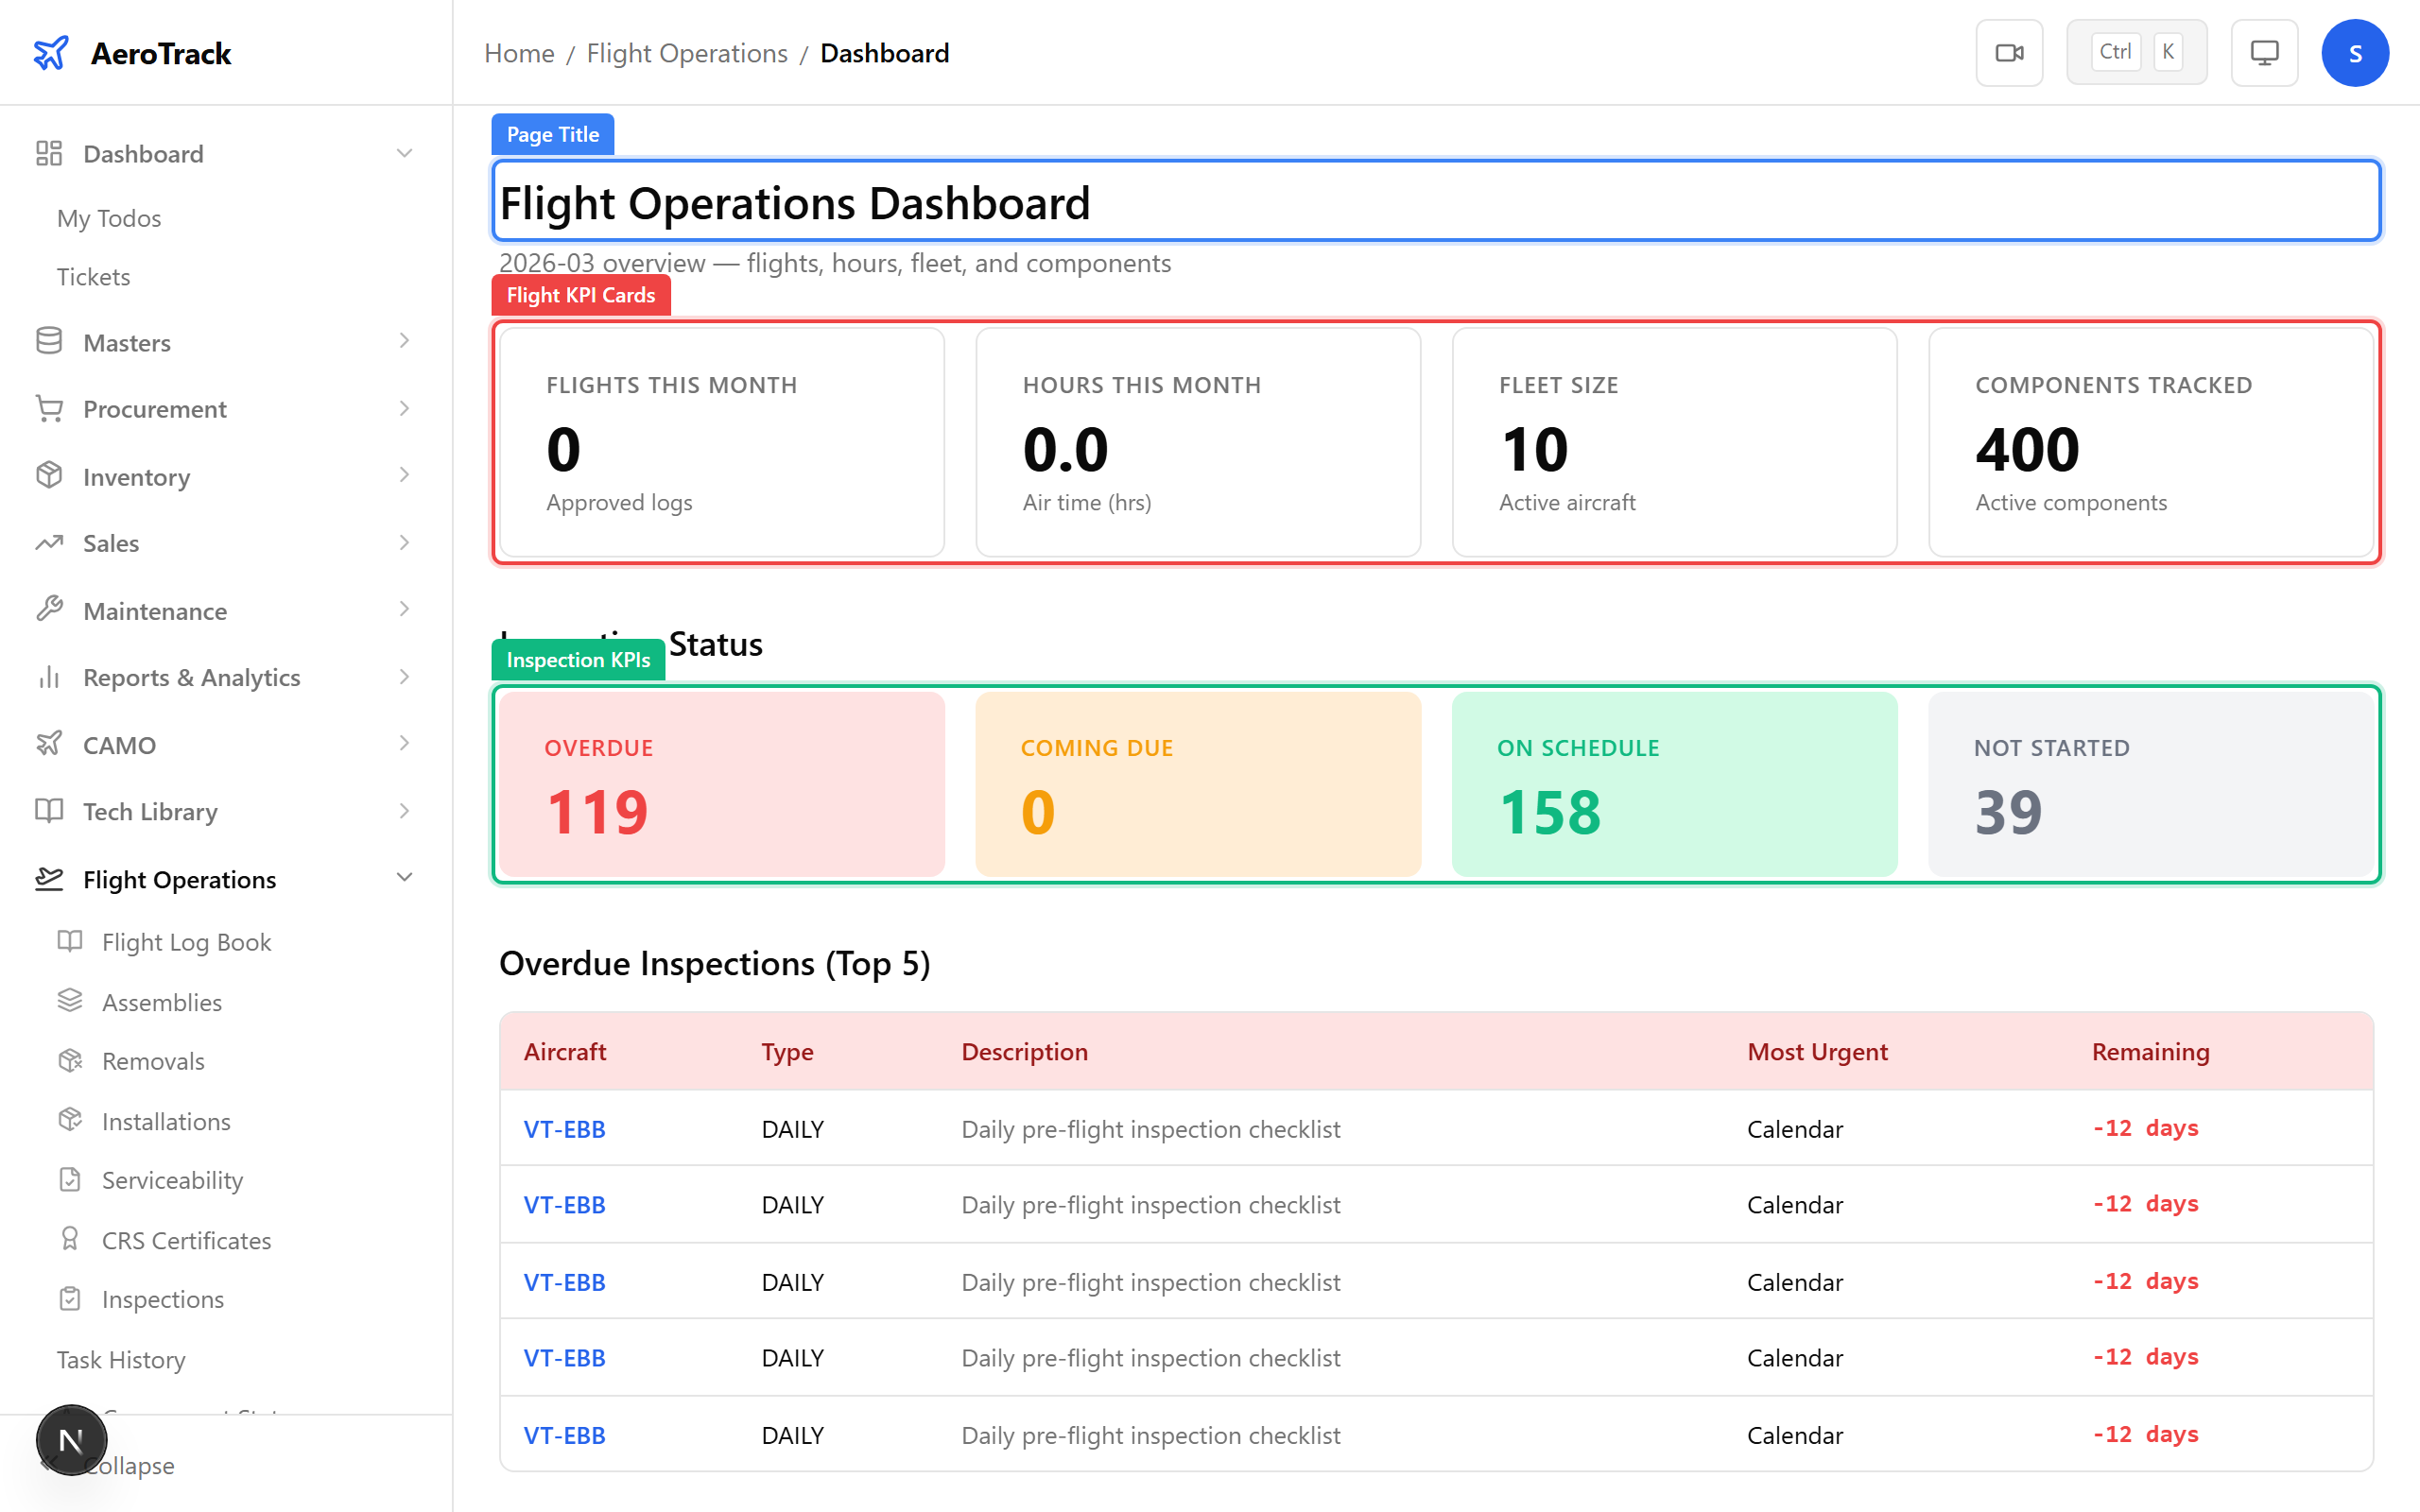
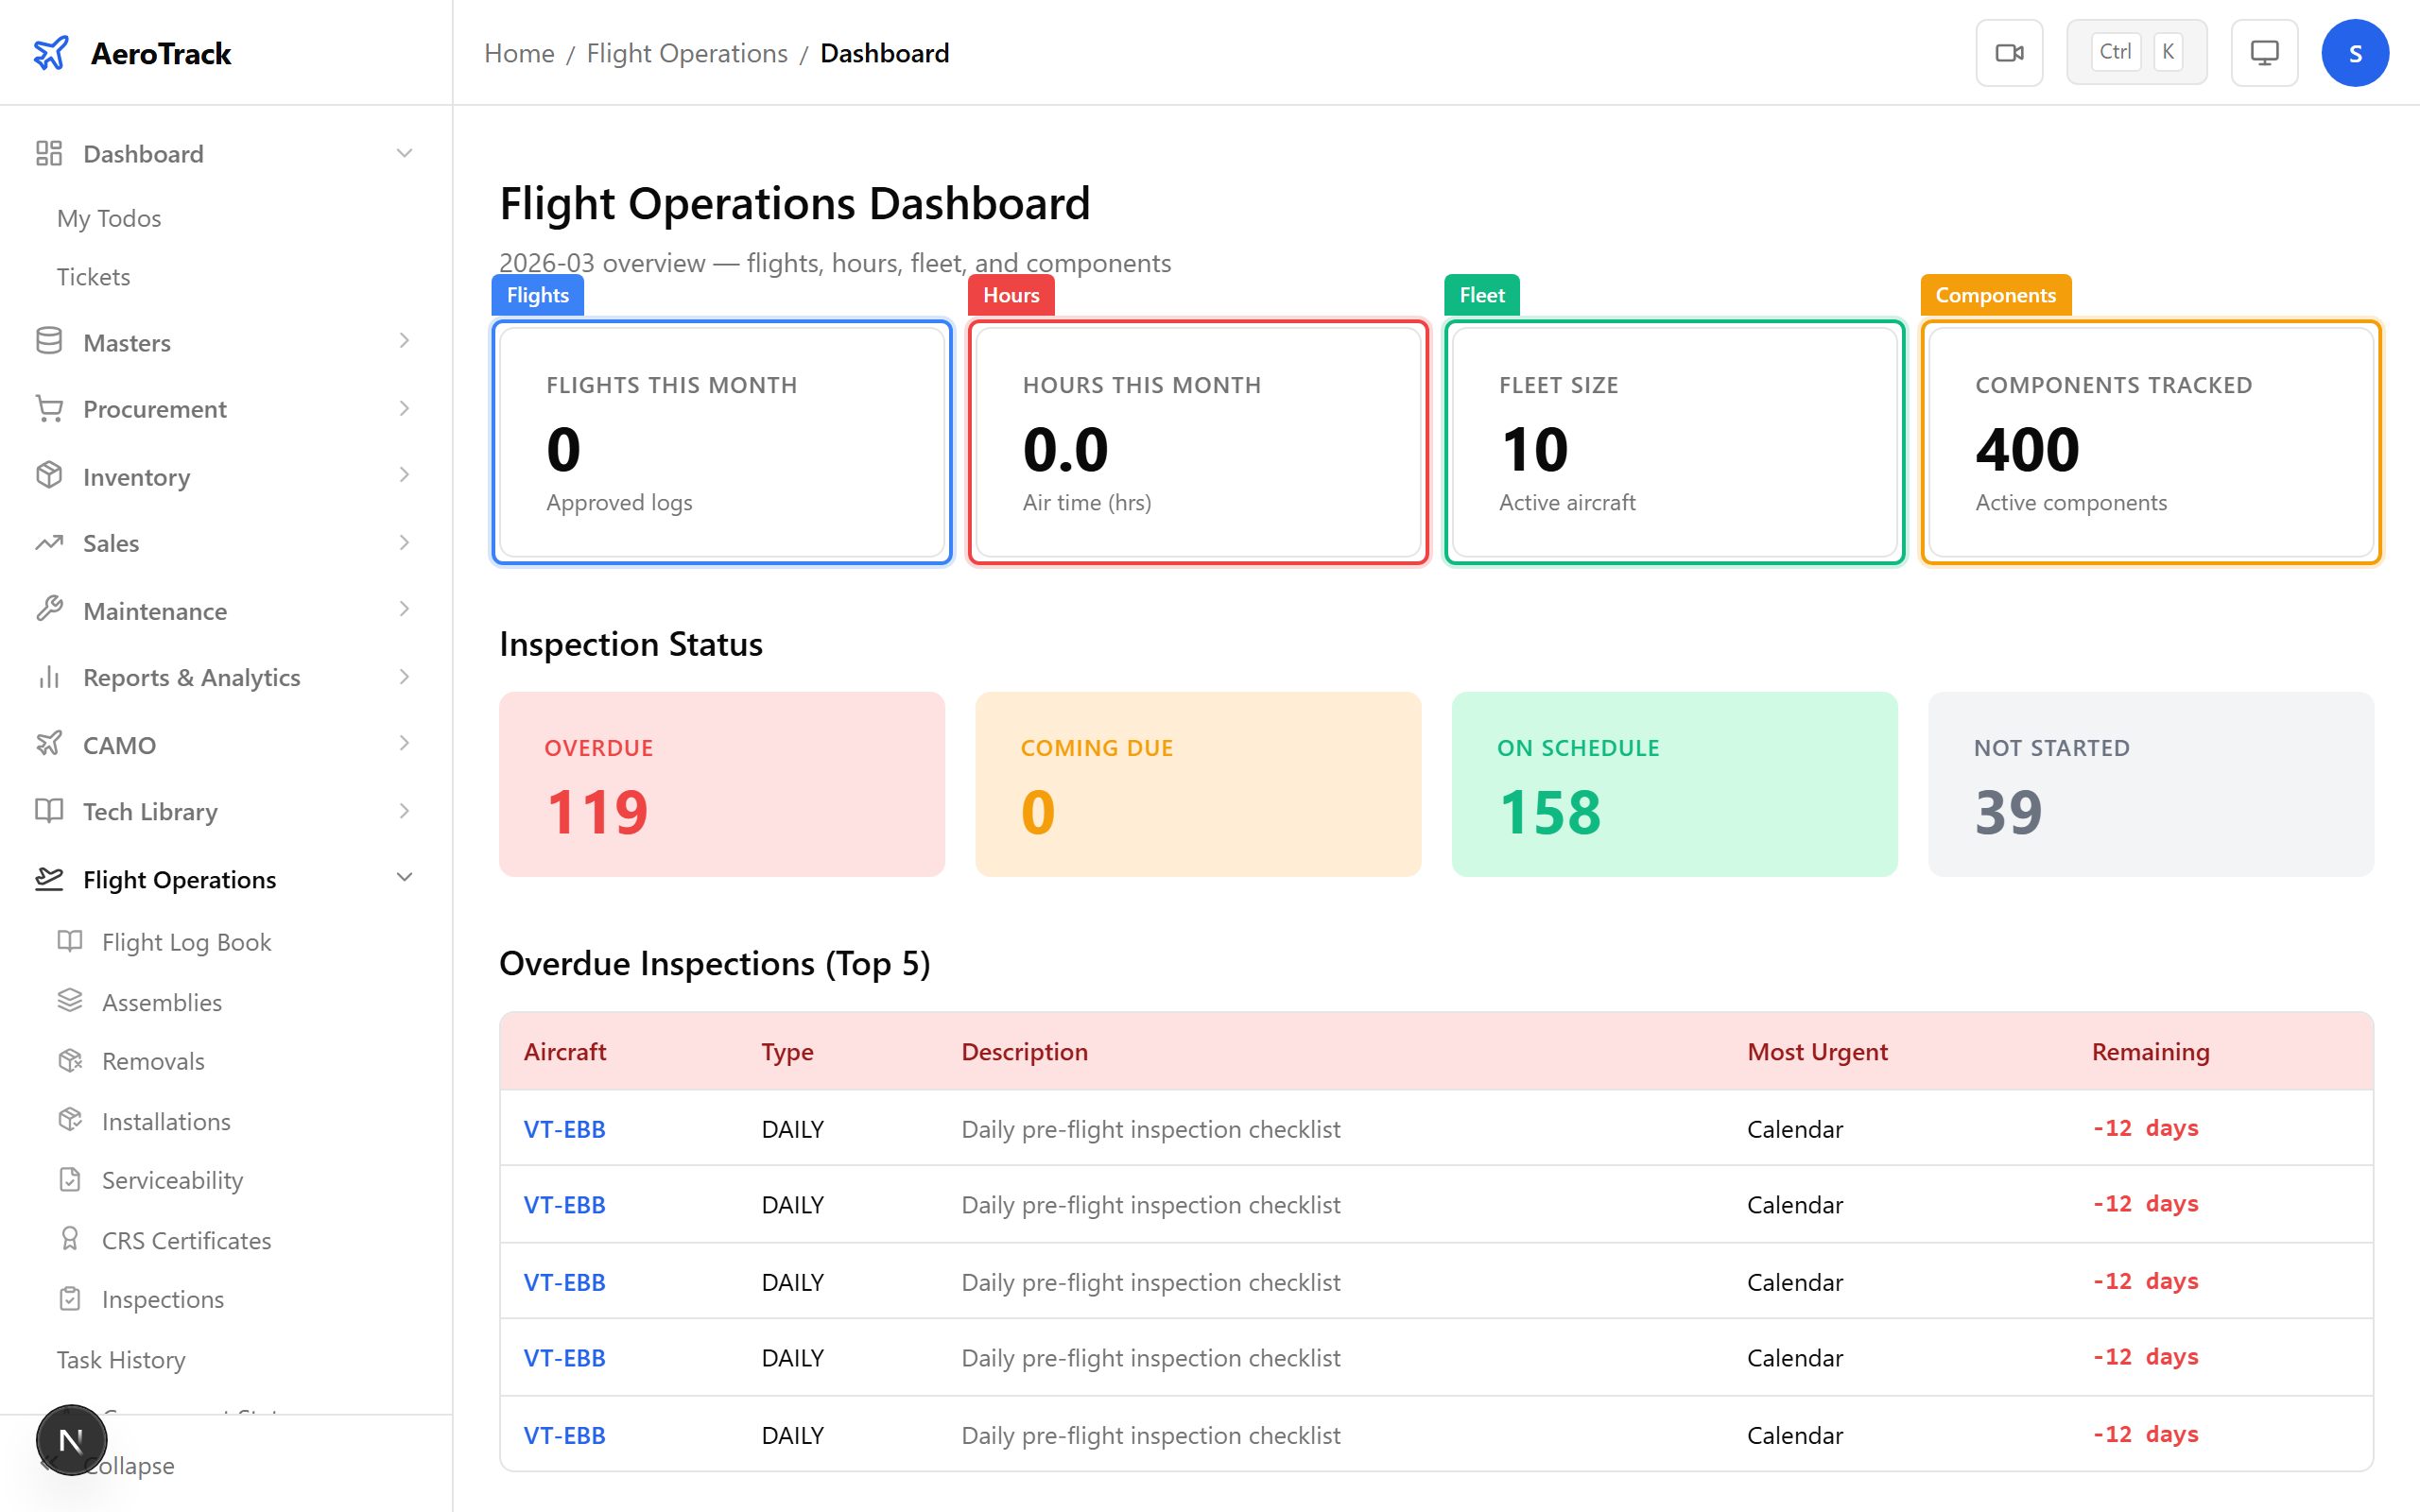
The top row shows four flight utilisation KPIs for the current month (approved logs only):
| KPI | Meaning |
|---|---|
| Flights | Total number of approved flight log entries this month. |
| Hours | Total air hours flown this month (sum of air time). |
| Fleet | Number of active aircraft in the fleet. |
| Components | Number of actively tracked components. |
Below the flight KPIs, a second row shows inspection status across the fleet:
| KPI | Meaning |
|---|---|
| Overdue | Inspections past their due date, hours, or cycles — requires immediate attention. |
| Coming Due | Inspections due within the configured horizon window. |
| OK | Inspections within normal limits. |
| Not Started | Inspections with no baseline “last done” data yet. |
Check Aircraft Utilisation
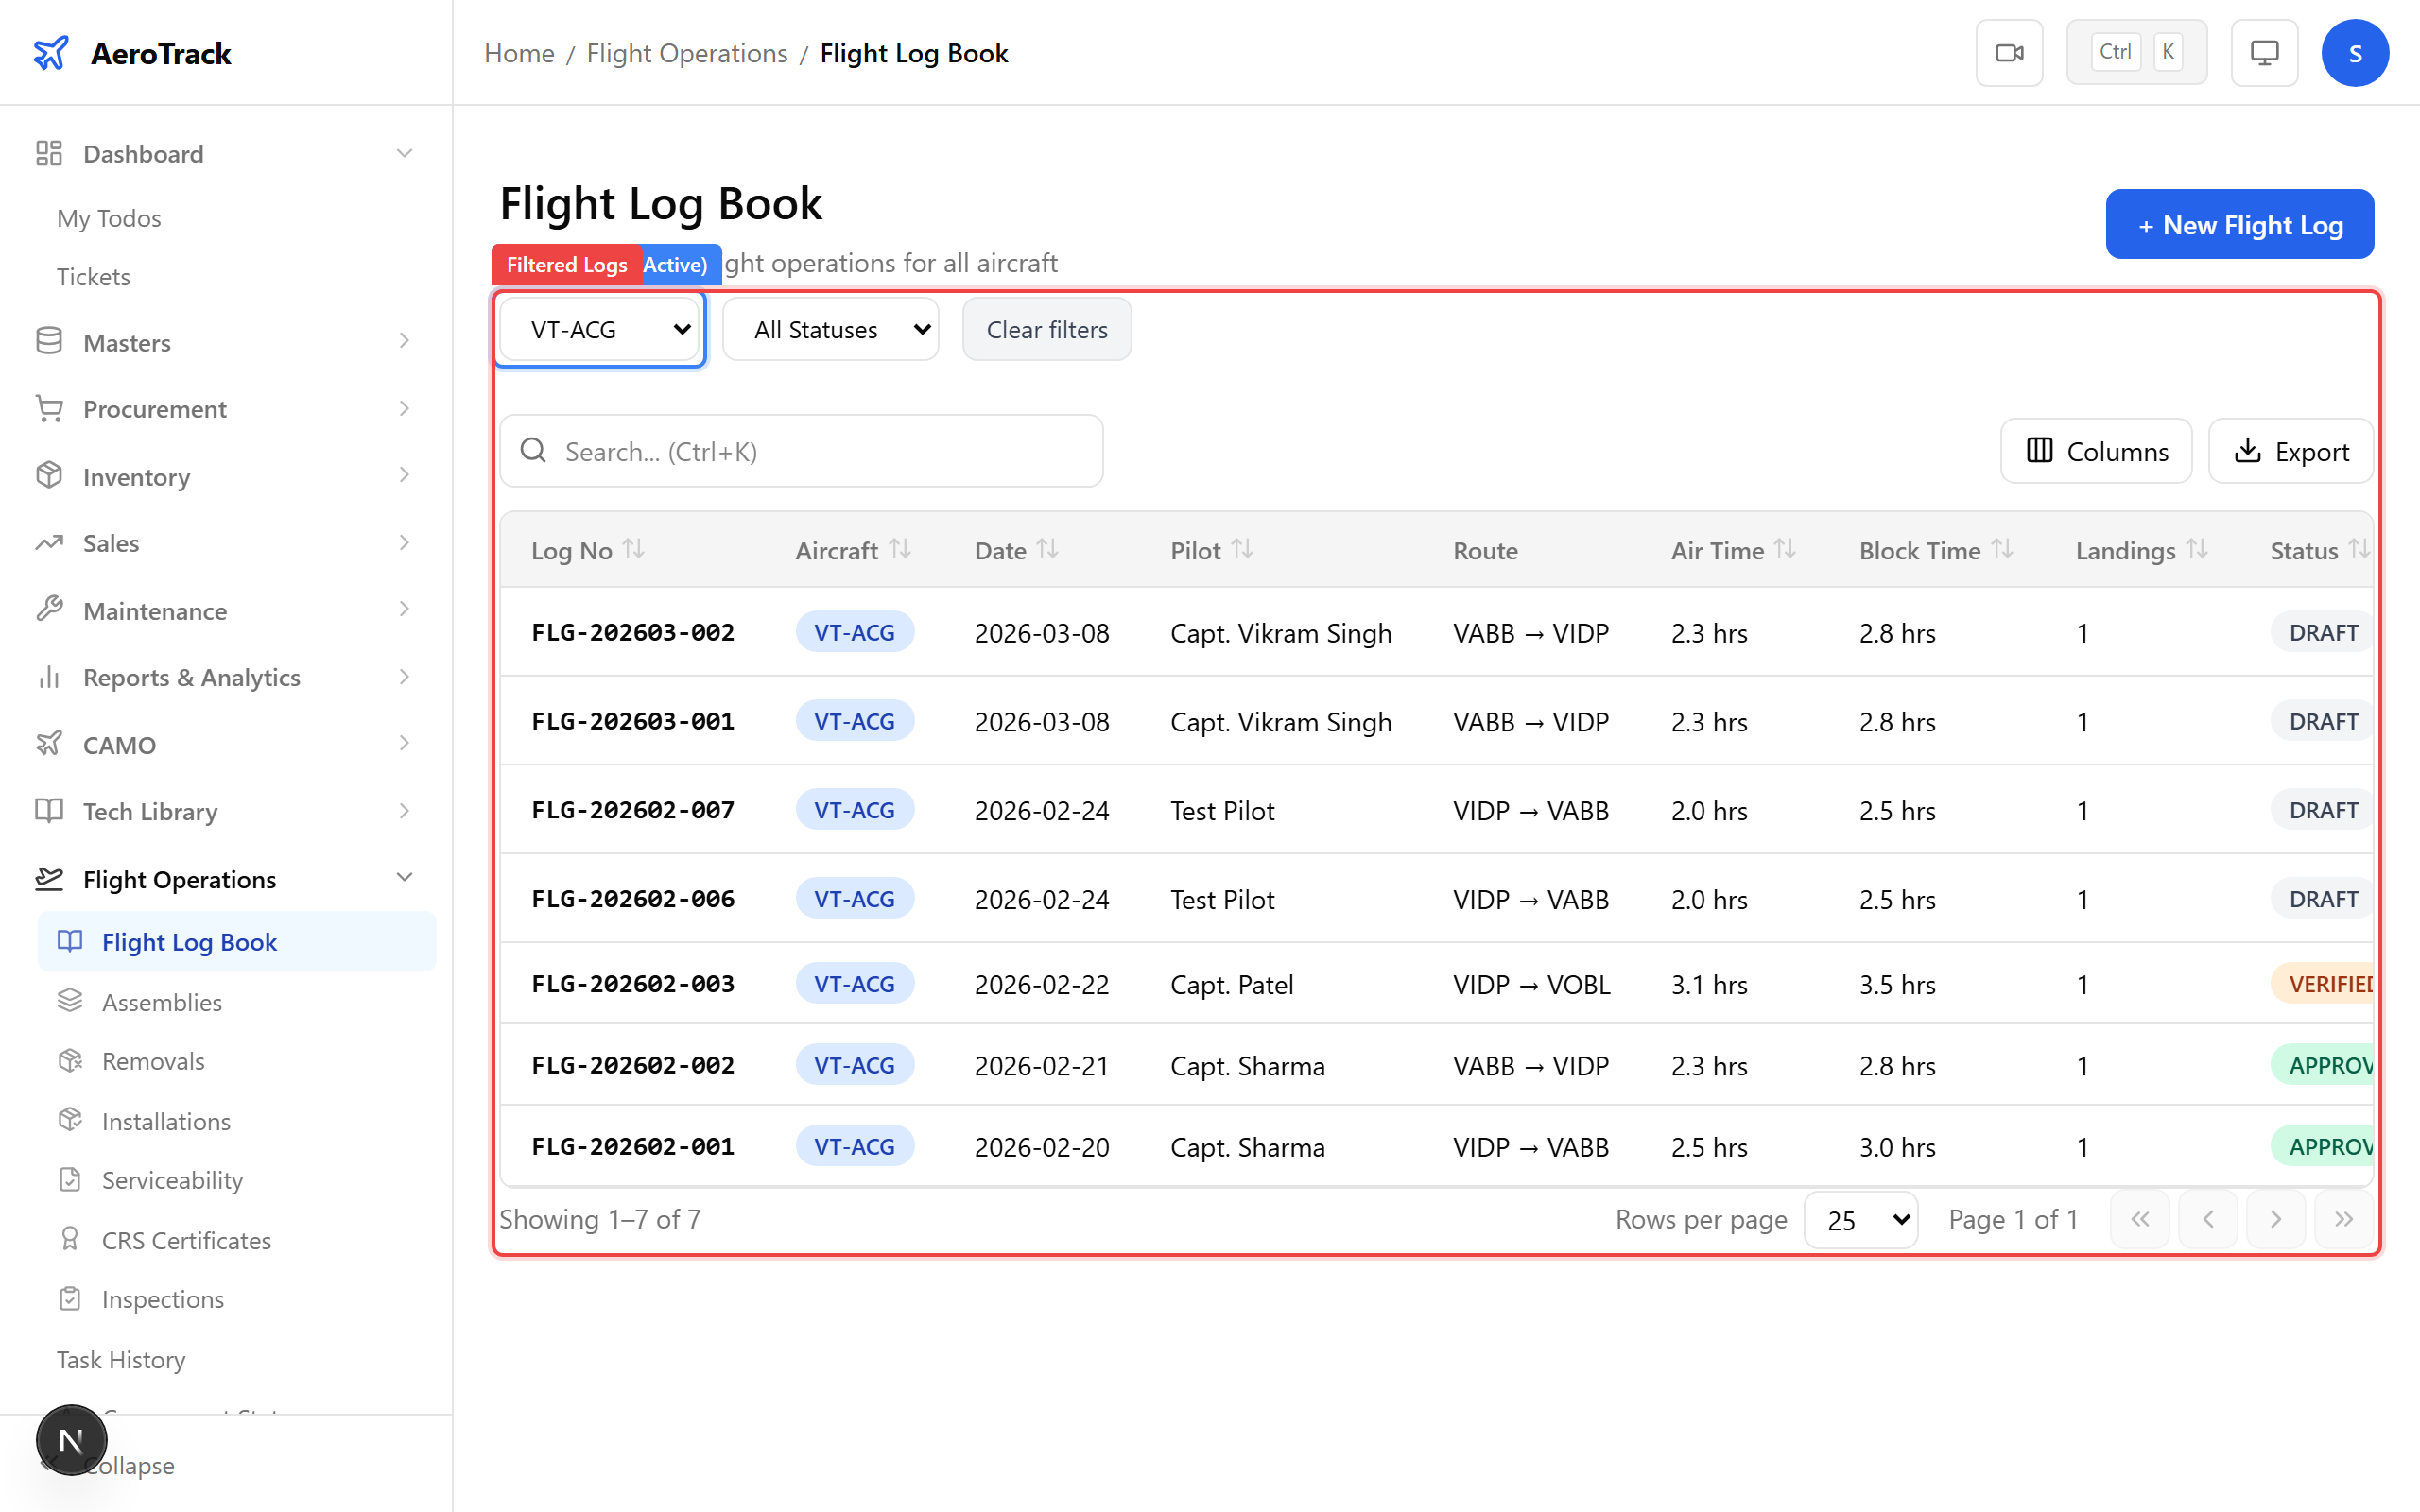
Navigate to Flight Operations → Flight Log Book. Use the Aircraft dropdown at the top to filter logs for a specific aircraft.
The filtered list shows all flights for that aircraft, with air time and block time columns giving a per-flight breakdown.
To see the cumulative hours and cycles for an aircraft, navigate to CAMO → Aircraft and click the aircraft row. The detail page shows:
| Field | Meaning |
|---|---|
| Total Hours | Cumulative airframe hours since new (updated when flight logs are approved). |
| Total Cycles | Cumulative landing cycles since new. |
For formatted utilisation reports, use these CAMO modules:
| Report | Location | What It Shows |
|---|---|---|
| Monthly Flying Summary | CAMO Reports → Flight & Fuel | Flights, hours, and cycles per aircraft per month. |
| Aircraft Hours Report | CAMO Reports → Fleet | Cumulative hours and cycles for each aircraft. |
| Fleet Utilisation Chart | CAMO Graphs → Fleet | Interactive chart showing monthly flying hours trends. |
| Fuel Consumption Report | CAMO Reports → Flight & Fuel | Fuel uplift and consumption per aircraft. |